
By the time the U.S. Forest Service declared the Mendocino Complex Fire 100 percent contained on Sept.18, it had scorched more than 459,000 acres, destroyed 157 homes and forced thousands to evacuate. One firefighter was killed and four others injured. It was the largest recorded wildfire in California’s history.
As the fires burned, air quality reached “unhealthy” levels in large regions of California and Western Nevada, and wind carried smoke from California all the way to the East Coast.
Knowing how smoke from wildfires travels through the atmosphere is critical for visibility, but also human health. Particulate matter from wildfire smoke can penetrate deep into the lungs and cause a range of health problems, according to the Environmental Protection Agency, “from burning eyes and a runny nose to aggravated chronic heart and lung diseases.”
Wildfires and the smoke they emit are notoriously difficult to forecast. This is because there are so many variables to account for: lightning, weather, and, of course, human activity.
“In the past, it was a challenge for the atmospheric models to know where the fire was, how active it was, and how much emissions it was putting into the atmosphere,” said Andy Edman, chief of the science technology infusion division for the western region of the National Weather Service.
But a new experimental model that relies on data from the Joint Polar Satellite System’s Suomi-NPP and NOAA-20 polar-orbiting satellites, as well as Terra and Aqua, has proved remarkably good at simulating the behavior of wildfire smoke.
How It Works
The High-Resolution Rapid Refresh Smoke model, or HRRR-Smoke, builds on NOAA’s existing HRRR weather model, which forecasts rain, wind and thunderstorms.
Central to HRRR-Smoke is an important metric called fire radiative power, or FRP. Fire radiative power is a measurement of the amount of heat released by a given fire, in megawatts, detected with the VIIRS instruments on Suomi-NPP and NOAA-20. A large fire, for example, might reach about 4,000 megawatts per pixel. Calculating a fire’s heat or intensity also helps scientists pinpoint its location.
The model combines this FRP data with windspeed, rain and atmospheric temperature, along with information from vegetation maps. Sagebrush burns differently than a ponderosa pine, and the more the scientists know about what’s burning, the better the simulations.
“Grass burns fast. And a dense forest has so much biomass to burn, so it’s going to produce much more smoke than a grassland,” said Eric James, a research associate with NOAA’s Earth Systems Research Laboratory and the Cooperative Institute for Research in Environmental Sciences at CU Boulder.
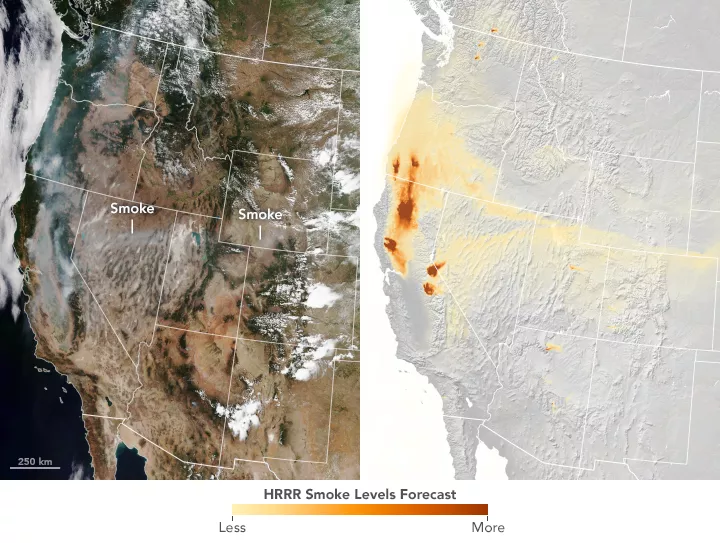
These measurements are mapped to a three-dimensional grid that extends nearly 16 miles into the atmosphere. What results is a detailed forecast of the amount of smoke produced, the direction it’s traveling and its plume height. HRRR-Smoke spits out these forecasts four times a day, extending out to 36 hours.
The forecasts are visualized as two plots: “Near-surface smoke” refers to the smoke about 26 feet from the ground, the kind responsible for burning eyes and worsening asthma. “Vertically integrated smoke” is all of the smoke in a vertical column, including smoke high in the Earth’s atmosphere. That’s the smoke you see at sunrise and sunset.
“Near-surface smoke is one indicator of air pollution, but the smoke could also be at much higher altitudes,” said Ravan Ahmadov, the main developer of the HRRR smoke model, and a research scientist at NOAA’s Earth Systems Research Laboratory and the Cooperative Institute for Research in Environmental Sciences at CU Boulder. “That’s important to know, because the smoke could affect visibility for aviation.”
Higher altitude smoke can also block incoming sunlight, which in turn can cool air temperatures and interfere with solar energy production.
“The key advantages of HRRR-Smoke are the high spatial resolution and the tight coupling with a weather forecast model,” Ahmadov said.
HRRR-Smoke is being used increasingly on the ground by forecasters and government agencies, but also by schools and sports teams. During California’s Ferguson fire, which burned from mid-July to mid-August, HRRR-Smoke simulations were consulted when the Department of Transportation made a decision to suspend Amtrak service and when the National Park Service closed parts of Yosemite National Park for three weeks. As fires burned south of Provo, Utah, schools opted to keep kids inside during recess and to cancel Friday night football games. In Oregon, a children’s swim coach moved outdoor swim practice to an indoor pool.
“If you have a child with asthma, you’ll know to take precautions,” Edman said. “When we can tell people that the smoke is going to move in and hang around for a day, they can take smart actions to anticipate the event.”
The Origin Story
The origins of HRRR-Smoke date back four years. Advances were happening simultaneously in several fields, and everything converged in the back row of a meeting in Madison, Wisconsin.
Scientists had recently developed the HRRR weather model, with its high-resolution representation of atmospheric convection. Convection describes the movement of energy from the Earth’s surface up into the atmosphere; convection that is sufficiently deep produces thunderstorms. Meanwhile, on the satellite front, scientists had zeroed in on fire radiative power from VIIRS. And atmospheric chemists were working to turn a fire’s intensity into an estimate of smoke emissions.
“All these major advancements were happening at same time,” Edman said. “When you read the history of science, I think this is not uncommon. People say, you got this, I got that, why don’t we get together and make something happen?”
The scientists acquired funding from the JPSS Satellite Proving Ground program, and they began holding meetings, running tests and working with forecasters.
Fast forward to present day, and a small team, led by Ahmadov, runs the model around the clock from a NOAA research lab in Boulder, Colorado.
The smoke forecast is a great example of the JPSS program’s “Proving Ground” initiatives, which seek to translate satellite observations into public services that ultimately affect decision making, said Mitch Goldberg, the chief program scientist for JPSS.
“Satellites are expensive, but the societal and economic benefits are huge. So we engage with the community to help them realize the benefits of our data,” Goldberg said. “Let’s say someone’s decision is simply, ‘Do I leave my house and seek shelter?’ Or you have families wanting to know if the air quality is good or bad and if they can go outside. We try to work with services, such as smoke forecasts, which would communicate that.”
Next Steps
The HRRR-Smoke model is still evolving. One limitation, Ahmadov said, is that each polar orbiting satellite passes over a single location in the continental United States twice a day, and fires can spread and evolve rapidly during the gaps in time.
Ahmadov’s ultimate goal is to add smoke to the regular HRRR model and transition it to operations at the National Weather Service. And he hopes to eventually incorporate data from geostationary satellites like GOES-16 and GOES-17. These satellites have a lower spatial resolution but would scan the fires more often.
“In the next couple years, I think we’re going to see a lot of small, incremental improvements,” Edman said. “The model’s not perfect, but all the components came together this year, and the forecasts were pretty darn good.”