


A mobile Doppler radar scans a supercell thunderstorm. Credit: NOAA
Satellite data is instrumental in identifying and tracking thunderstorms that can produce hail, lightning, flooding, and strong winds.
A combination of moisture, unstable air, and rising warm air can create a thunderstorm. Under these conditions, strong convective currents called updrafts form cumulonimbus clouds – the flat, anvil-shaped clouds that drive severe weather.
Convection
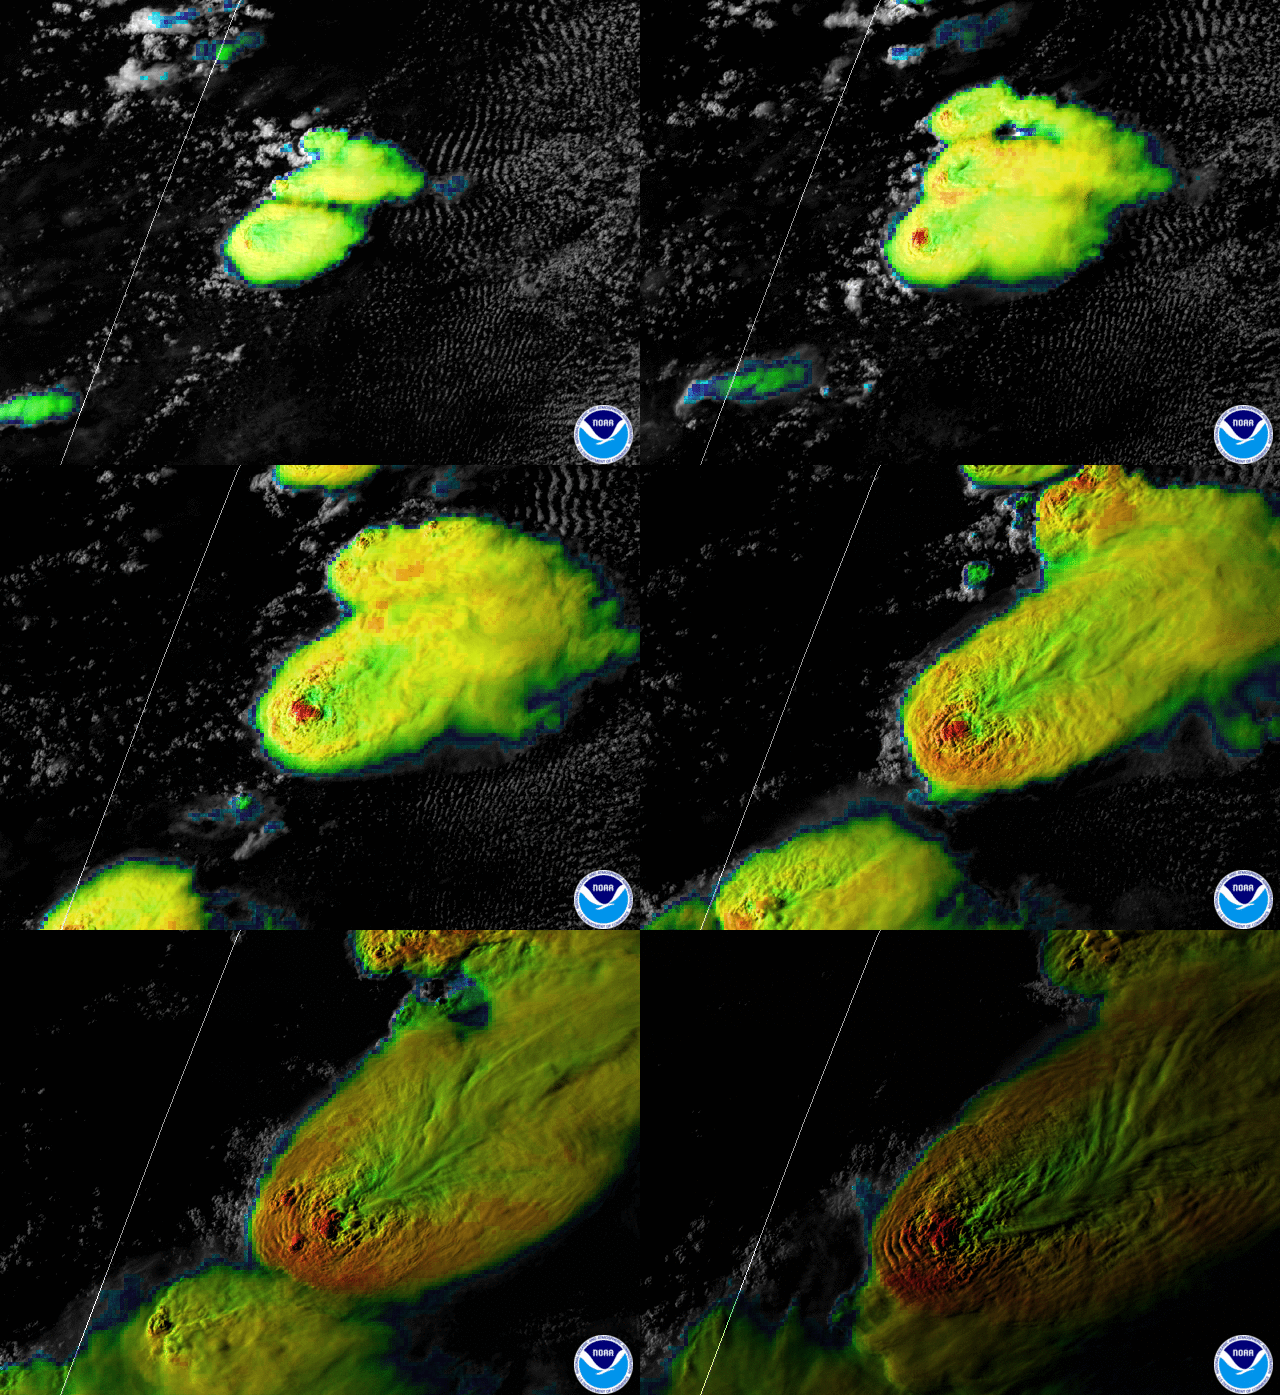
The terms "convection" and "thunderstorms'' are often used interchangeably, but thunderstorms are only one form of convection. Convection is simply a vertical transport of heat and moisture in the atmosphere, like updrafts and downdrafts. Updrafts occur when warm, moist air is pushed upwards. That moist air cools and condenses into water droplets, which can eventually fall as rain, snow or hail. When these convective currents rotate rapidly and turn vertical, they can produce tornadoes. NOAA’s GOES-R satellites capture growing convective clouds in near-real-time as a storm develops, keeping forecasters up to date on the storm’s progress. Meanwhile, data from NOAA’s JPSS satellites are used to predict these storms days in advance.
Lightning
Lightning occurs between strong electric fields that develop within convective storms. The updrafts and downdrafts within the storm force ice particles of varying sizes and charges to collide. These collisions create pockets of opposite charge, often close together, which can cause lightning within the clouds. Storms also produce an opposite charge on the Earth’s surface, which can cause cloud-to-ground lightning strikes.

This animation from NOAA’s GOES-East satellite shows lightning from the storms in a derecho moving across the Midwest on August 10, 2020. Credit: NOAA
Satellite data and artificial intelligence (AI) have made it possible to predict where lightning is most likely to occur. LightningCast is a tool that scans large amounts of imagery from the Advanced Baseline Imager (ABI) and uses AI to make predictions. Using algorithms, it analyzes these images for cues that lightning may be about to form. It can often predict a lightning strike before the precipitation even starts. This early notice can be vital in warning people to seek shelter before the severe weather arrives. It also helps warn of lightning threats that are still present in storms with sporadic activity.
An increase in lightning often acts as one of the first signs of a storm gaining intensity. The Geostationary Lightning Mapper (GLM) gives forecasters an early look at this activity so they can spot thunderstorms and tropical systems before they become dangerous. It’s also used as an indicator for lightning safety alerts. Around 400 people are struck by lightning each year in the United States, with anywhere from 20 to 50 of those resulting in fatalities. The GLM can also help estimate rainfall, detect lightning-caused wildfires, and inform airline routes to protect passengers and air crews from dangerous storms. Satellite data from the GLM fills in gaps, especially in remote regions and oceans with limited ground monitoring.
Since the GLM updates faster than radar at every 20-60 seconds, it can be used to detect severe weather up to five minutes earlier, giving people in vulnerable areas more time to evacuate or find shelter. When combined with other satellite data, surface observations, and radar, this information can facilitate earlier severe weather warnings with fewer false alarms.
Hail

Severe thunderstorms can produce large hail, which is very dangerous for anyone caught in the storm and causes damage to homes, sheds, vehicles, and crops. Hail comes from convective currents that cycle ice pellets through updrafts and downdrafts. Those pellets grow larger as they combine with condensed water vapor and then refreeze with each cycle. Eventually, they become too heavy for the updraft and fall to the ground. The stronger the updraft, the bigger the hail. The Geostationary Operational Environmental Satellites (GOES) keep watch for these storms, ensuring forecasters have the data to warn the public as soon as possible.
Derechos

A derecho (pronounced deh-REY-cho) is a rapidly moving band of thunderstorms with strong, straight-line winds that move along a relatively straight path. These winds are at least 58 mph, but are often much faster and cut a path of more than 240 miles. Derechos are caused by downbursts, or very strong downdrafts that hit the ground and rush outward in one direction, causing damaging, straight-line winds.

Derecho storm front approaching Sarpy County, Nebraska. Credit: Public Domain
The GOES-R and JPSS satellites can take detailed pictures of these storms. The ABI on the GOES satellites visualizes the storm’s thermal structure and cloud properties in near-real-time. This is instrumental in aiding forecasters in predicting the storm’s strength and direction.
Flooding
Severe flooding usually occurs due to heavy rain or quickly melting snow and ice. Geography can also play a role in whether flooding will occur. Coastal areas vulnerable to storm surge, low-lying land near rivers, cities with limited space for rainwater to soak in, and regions affected by drought are all more likely to encounter flooding.
Accurate, reliable rainfall data from NOAA’s GOES and JPSS satellites is vital for predicting flash floods and planning an emergency response. The GOES satellites record clouds and atmospheric conditions in near-real-time. Access to this data enables forecasters to track rapidly changing weather conditions and to issue flood warnings well in advance. NOAA flood maps, which use data from both GOES and JPSS satellites, help determine the impact of a storm. They outline where flooding is happening, how long it will last, and the extent of the damage.


