
The JPSS Program Science Team ensures the scientific integrity of the JPSS mission and oversees user readiness through management of data user requirements and evaluation of scientific JPSS products. Additionally, the team establishes forums for user engagement to assess the use of JPSS products and services and a variety of other applications.
The JPSS Science Team also coordinates the prelaunch testing of each instrument JPSS satellites carry to ensure that they will operate as expected in space.
JPSS data in various applications.
Explore
JPSS Helps Us Understand Extreme Weather
Click on the red dots in this spinning planet to see the role the JPSS satellites have played in major weather events:
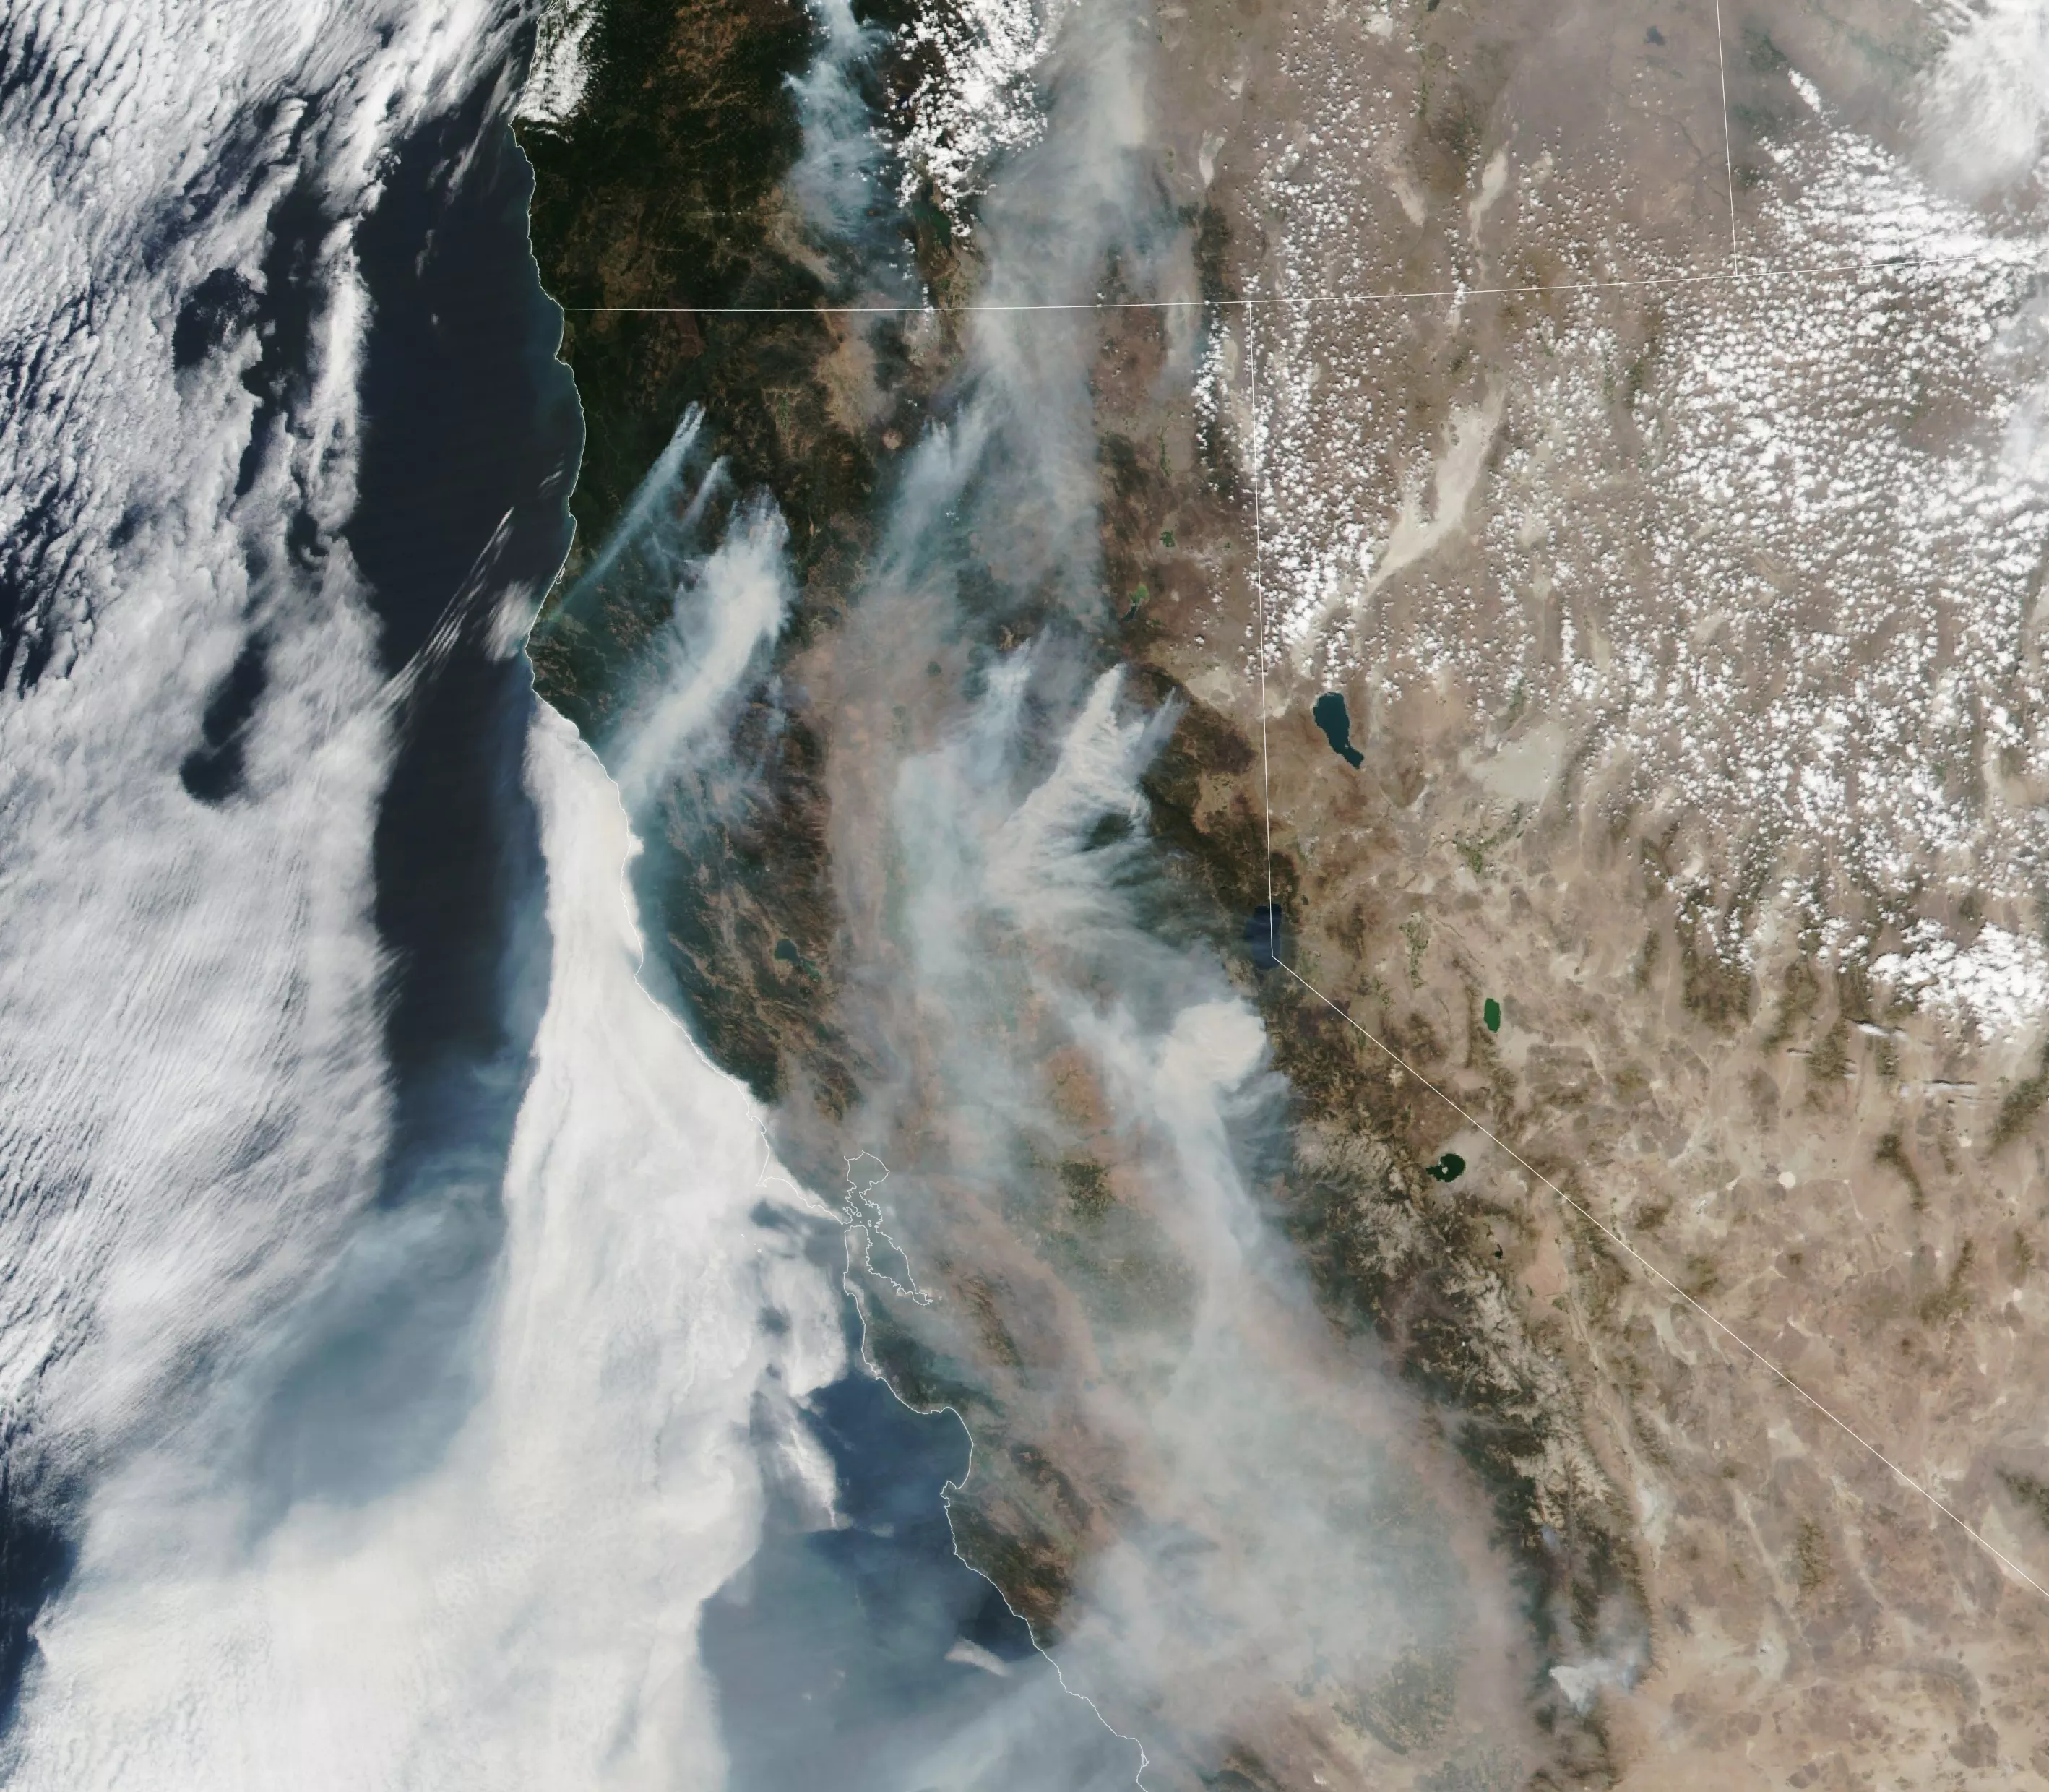
California Wildfires
The Visible Infrared Imaging Radiometer Suite (VIIRS) instrument captures natural-color images of fires, like the massive Dixie fire seen here, the second largest in the state’s history. Scientists also use VIIRS data to detect and map fires in remote places like Alaska, where remote-sensing airplanes don’t fly.
VIIRS also contributes measurements to a model called HRRR-Smoke, which simulates the behavior of wildfire smoke–its thickness and movement, both high above the clouds and on the ground. At the surface, fine smoke particles can penetrate deep into the lungs and aggravate a range of health problems, such as asthma and heart and lung disease. Smoke high in the atmosphere can also affect visibility for pilots and block incoming sunlight.
Image credit: NASA Earth Observatory
Hurricane Ida
On August 29, 2021, Hurricane Ida made landfall near Port Fourchon, Louisiana, as a strong Category-4 storm–exactly 16 years after Hurricane Katrina struck the area. Ida brought with it torrential rainfall, flooding and sustained winds as high as 150 mph that tore off roofs, downed trees, damaged whole neighborhoods and snuffed out power to more than a million homes. As it approached landfall. Ida’s wind speed, fueled by unusually warm ocean temperatures, atmospheric moisture, and low wind shear, increased by 65 mph in 24 hours. Its remnants then swept northeast, where it caused devastating flooding in New Jersey, New York, Pennsylvania and Connecticut and led to nearly four dozen confirmed deaths.
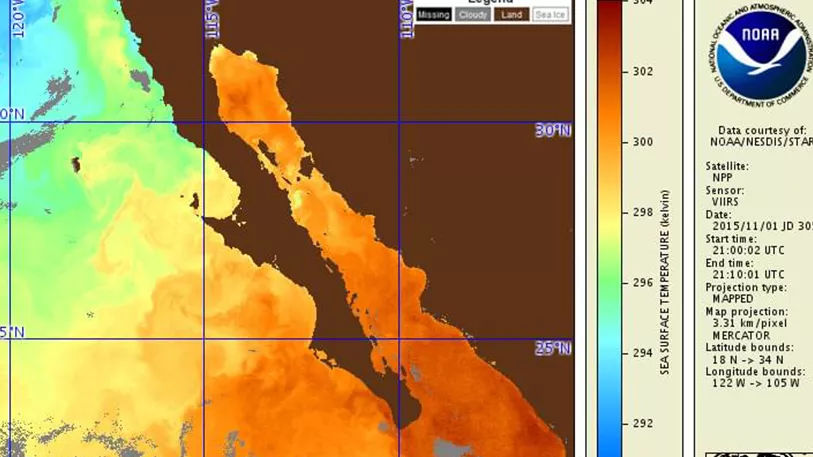
The Advanced Technology Microwave Sounding (ATMS) instrument took measurements that provided early warning of this storm. By measuring atmospheric temperature and moisture, as well as sea surface temperatures, ATMS gives forecasters data they need to predict how a hurricane will track, along with its intensity. These data are combined with ground-based observations and weather models, and they help people make important decisions on whether they need to take shelter or evacuate.
Image credit: NOAA
Drought And Heat Waves In The American West
The drought that has gripped the American West since 2000 is the worst the region has seen in at least 1,200 years, according to a recent study in the journal Nature Climate Change.
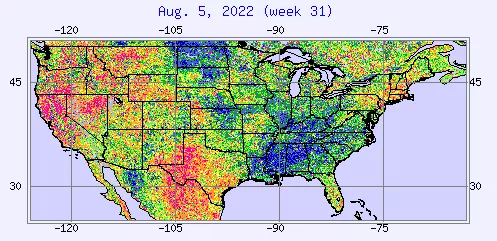
A product from the VIIRS instrument called the Vegetation Health Index shows vegetation and crop health, represented in color coded maps, like the one seen here. Green and blue indicates lush, healthy growth; red means parched and dry.
This product informs the U.S. Drought Monitor map, which plays an important role in decision-making involving agricultural reimbursements and other government assistance. It is also used regularly by meteorologists at the U.S. Department of Agriculture to monitor global crop growth.
Image Credit: NOAA STAR. The Vegetation Health Index Map shows crop health in the United States on August 5, 2022.
Phytoplankton Bloom
Barents Sea
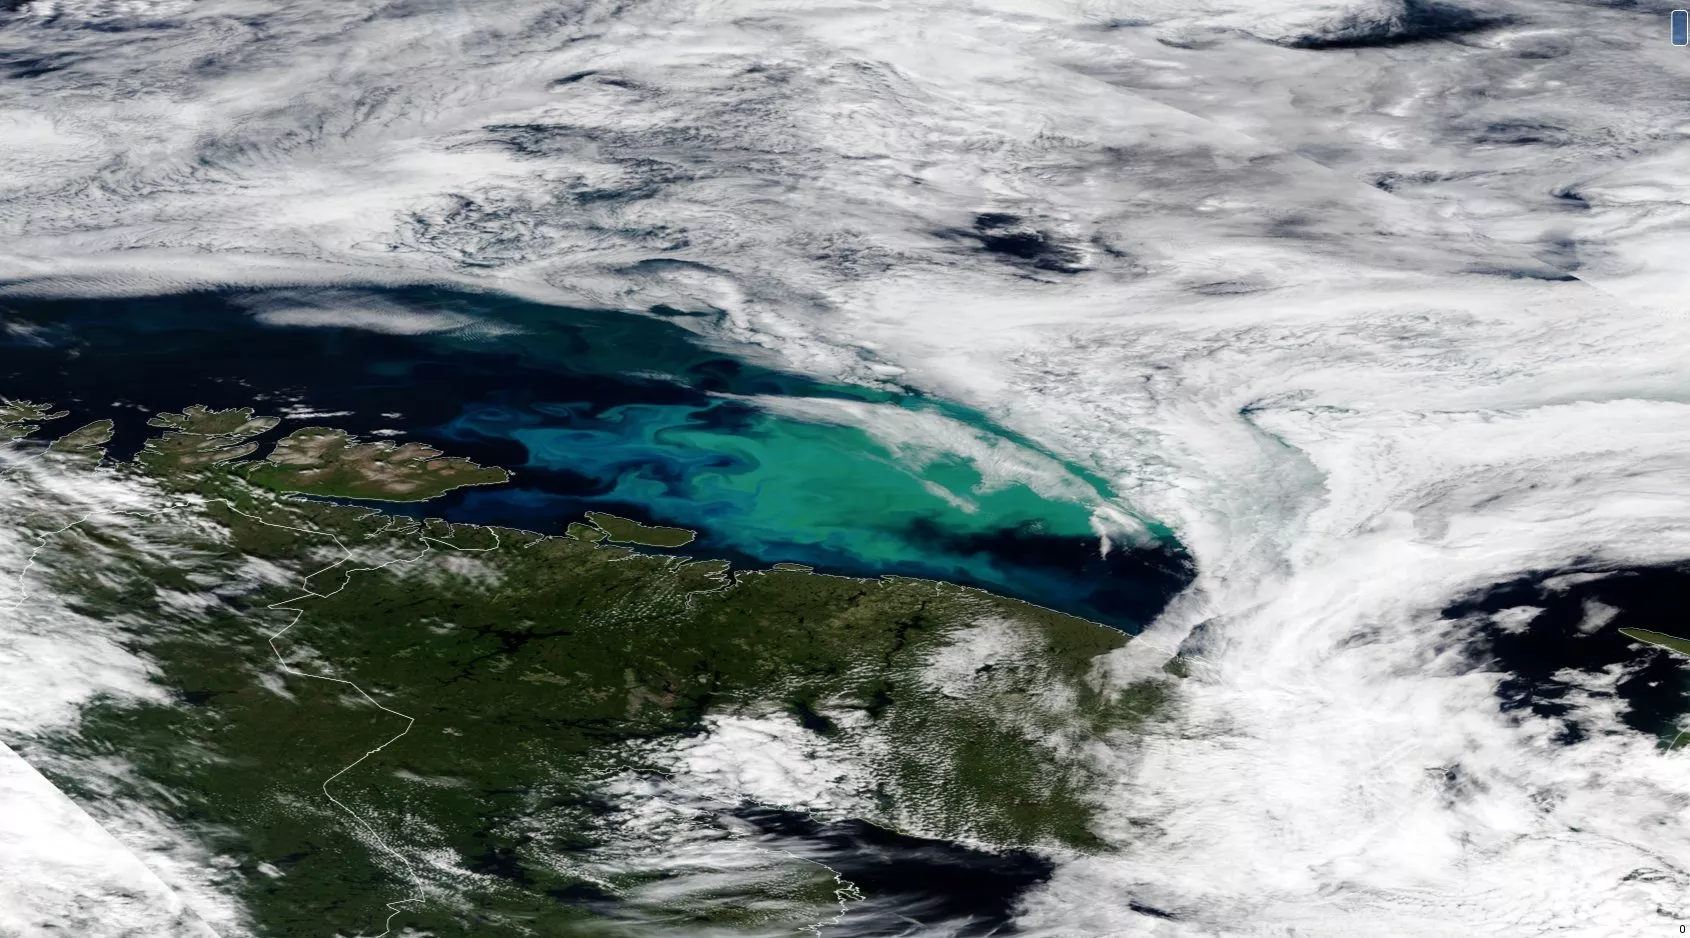
The JPSS satellite’s VIIRS instrument captures vibrant blue and turquoise swirls, indicating a phytoplankton bloom north of Finland. Phytoplanktons are tiny, microscopic plants that form at the base of food webs in marine ecosystems and thrive in Arctic waters. They are common in this location in late July and August, thanks to a combination of 24-hour sunlight, minimal ice cover and relatively warm surface waters. This image is from the Suomi-NPP satellite.
Image Credit: NOAA. The vibrant blue and turquoise swirls in the center of the image show a phytoplankton bloom north of Finland.
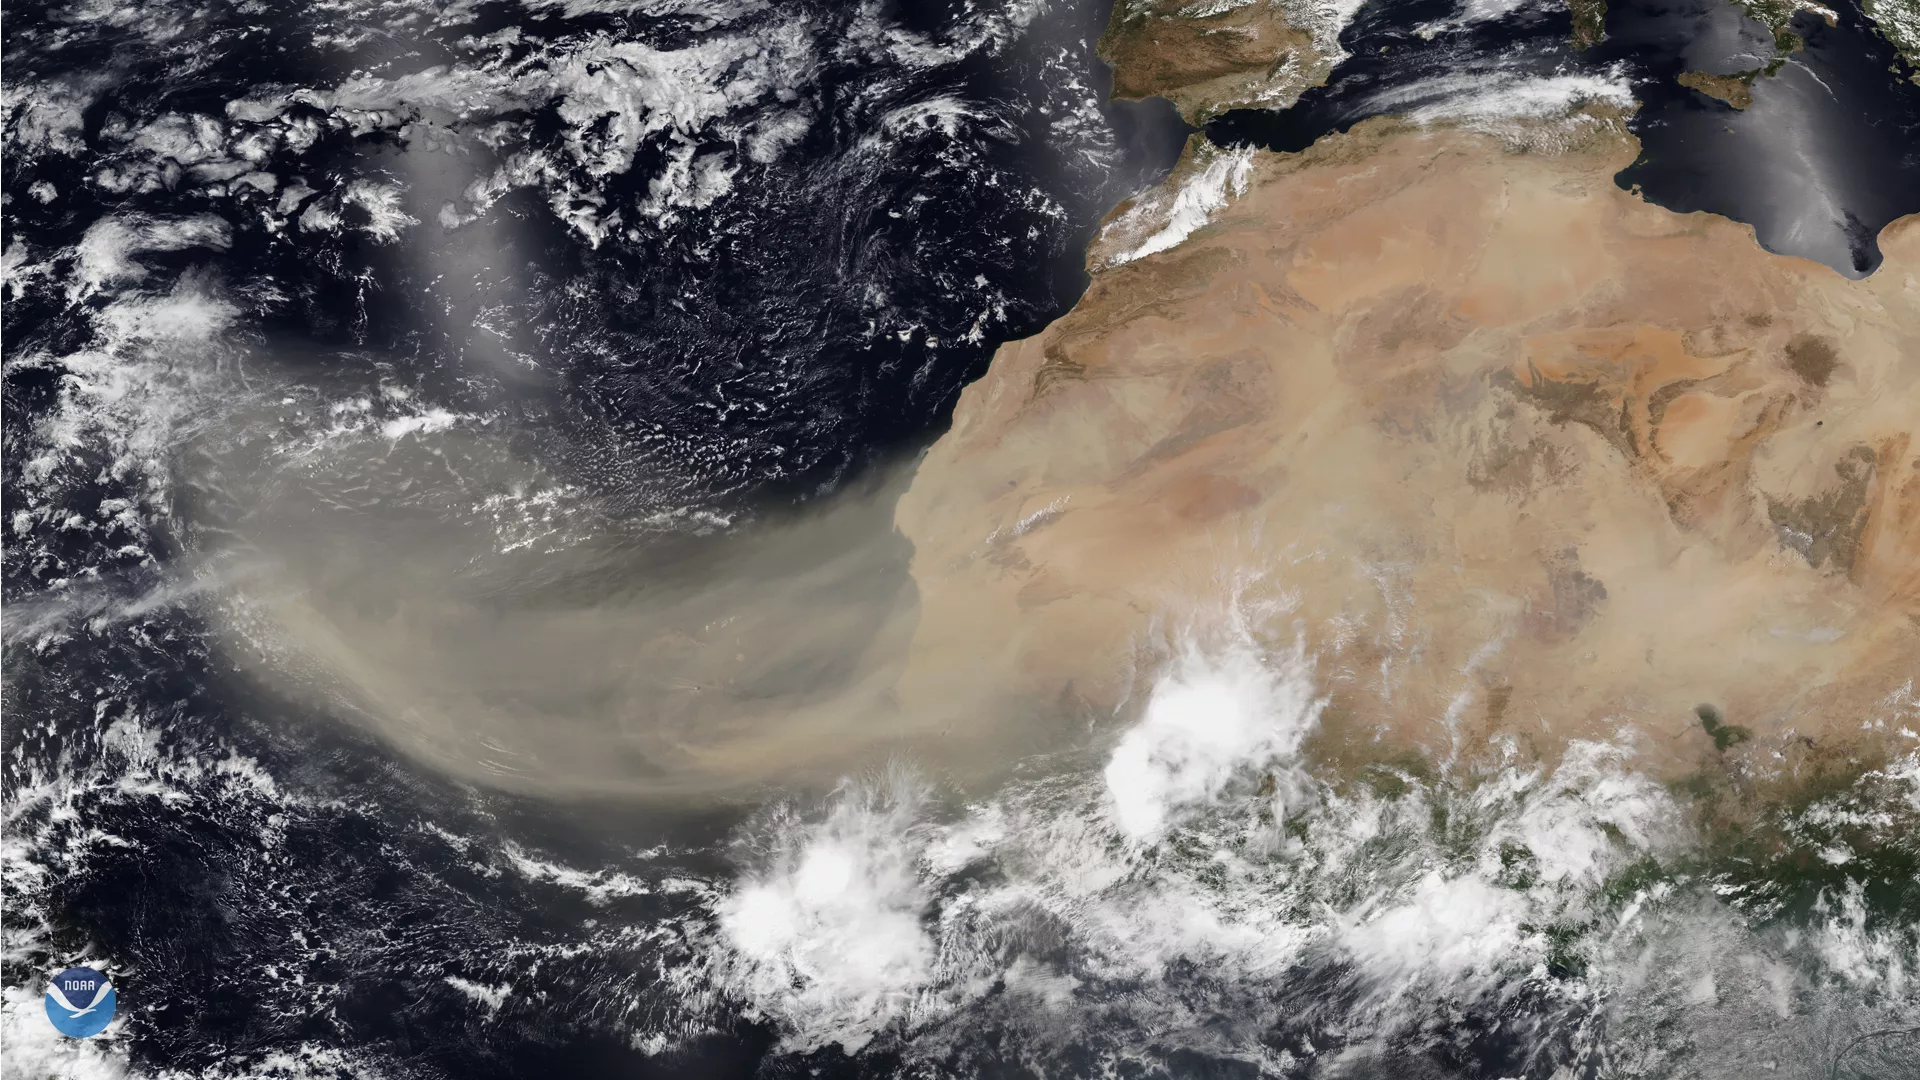
Saharan Dust Storm
Northwest Africa
For several days in February and March 2022, strong winds from the Sahara Desert carried sand and dust east off the coast of Africa, over the Atlantic Ocean and north toward Europe. The Saharan Air Layer, a mass of dry, dusty air that forms over the desert and extends as high as 20,000 feet into the atmosphere, can travel several thousand miles, grounding flights, turning the sky orange and suppressing cyclone development during hurricane season, but also bringing minerals that replenish soil nutrients as far away as the Amazon Rainforest.
The JPSS satellites’ OMPS instruments measure aerosols from the dust plumes, monitoring air quality and visibility for aircraft.
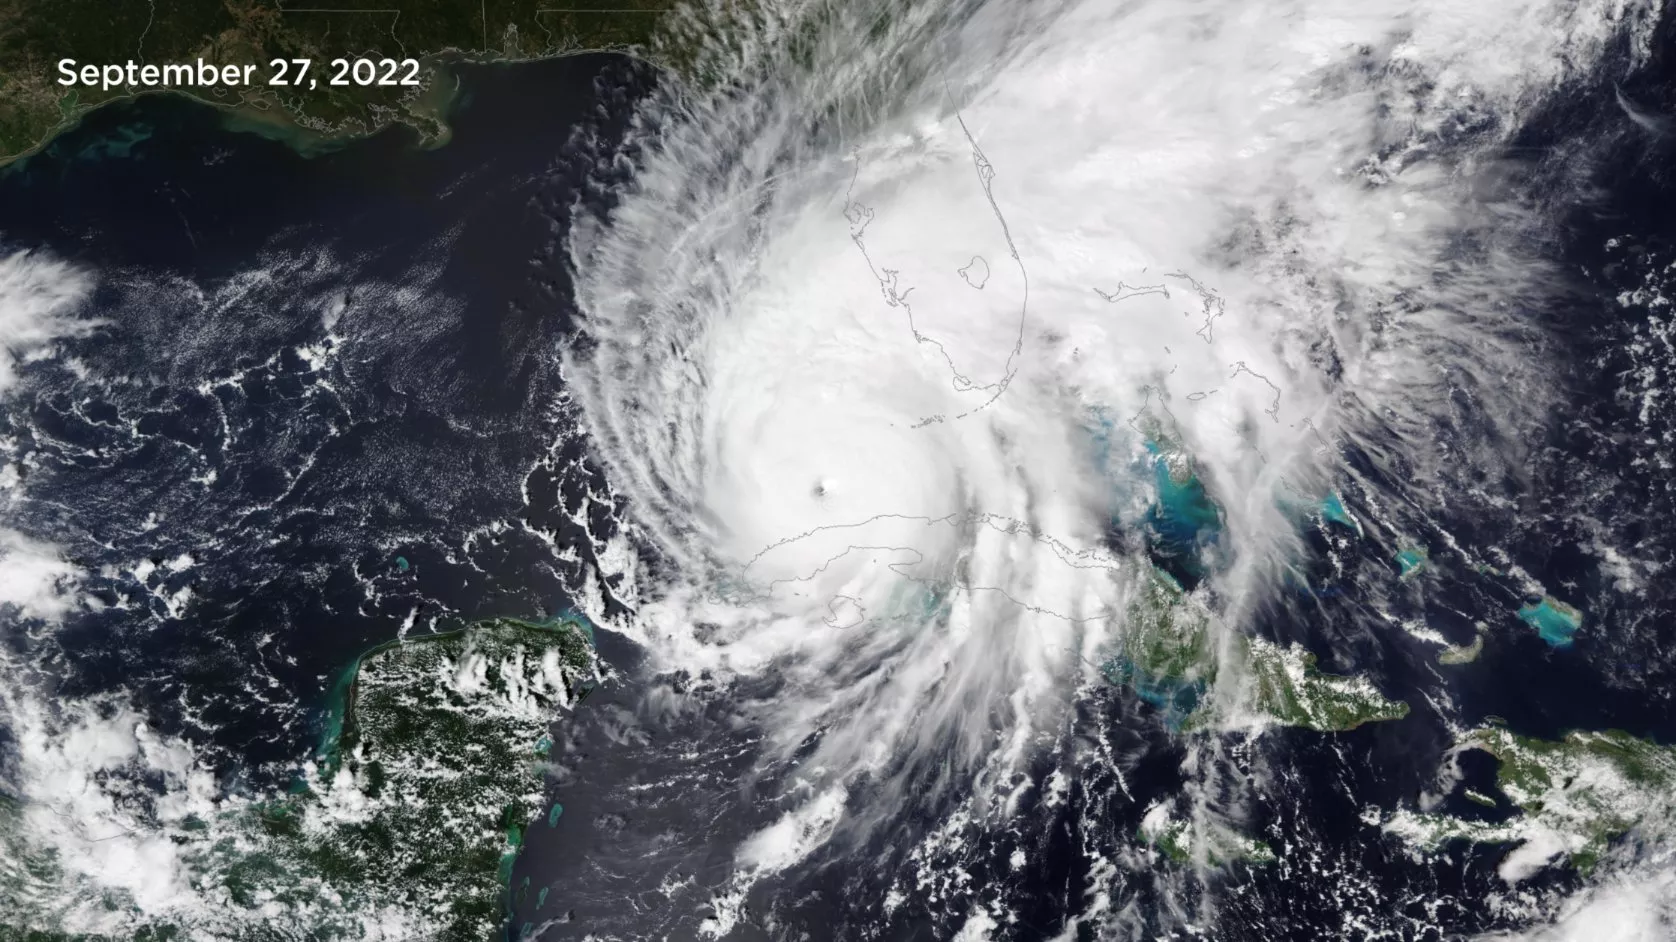
Hurricane Ian
Cayo Costa, Florida
Hurricane Ian, one of the most powerful storms ever recorded in the United States, made landfall to the west of Ft. Myers, Fla., on Sept. 28 as a Category 4 hurricane after causing widespread damage in western Cuba. In Florida, the storm destroyed entire coastal communities and unleashed a dangerous storm surge before moving up the coast, where it made a second landfall in South Carolina on Sept. 30. The storm was responsible for more than 120 deaths, according to state and county officials.
This image, captured by the NOAA-20 satellite on Sept. 27, shows the massive, well-organized storm approaching Florida’s coast.
Hunga Tonga-Hunga Ha-Apai Volcanic Eruption
When the Hunga Tonga-Hunga Ha’apai volcano massively erupted on Jan. 11, 2o22, it unleashed a plume of ash and smoke that spewed more than 20 miles into the atmosphere, sent a shockwave around the world and triggered a tsunami that devastated parts of the Pacific island nation of Tonga.
As JPSS satellites passed over the volcano, their Ozone Mapping and Profiler Suite (OMPS) instruments measured sulfur dioxide emissions in the plume spewing from the eruption. The volcanic plume contains particles made of glassy silicate ash and sulfuric acid droplets, as well as gases, both of which are health hazards in high concentrations.
Volcanic clouds can pose threats to aircraft by affecting cabin air quality, damaging the airframe and engines, and reducing visibility.
Image Credit: NASA OMPS processing team. This map shows a stratospheric sulfur dioxide cloud over the Pacific Ocean from January 15, 2022 eruption of Hunga Tonga – Hunga Ha’apai underwater volcano (triangle) near the Pacific Island Nation of Tonga. These measurements were collected on January 17, 2022 by the OMPS instrument on the Suomi-NPP satellite.
Giant Iceberg Breaks Off Antarctica
Western Side Of Ronne Ice Shelf
In May 2021, an iceberg nearly the size of Delaware sheared off from the edge of Antarctica and floated into the Weddell Sea, where it fractured into pieces. The iceberg, named A-76 by the U.S. National Ice Center, measured 1,668 square miles before breaking up.
The VIIRS instrument on the JPSS satellites observed A-76 splitting from the Ronne Ice Shelf on May 15 and 16 during multiple flyovers.
VIIRS can see ice sheets, ice shelves and icebergs, such as A-76, at a high spatial resolution of 375 meters, and the instrument's wide swath and frequent overpasses at the poles resulted in good coverage of this calving event.
VIIRS also plays an important role in mapping and monitoring glaciers, along with measuring the surface albedo and temperature of ice sheets and the ice concentration, thickness, surface temperature and motion of sea ice.
JPSS Helps Us Understand Extreme Weather
Click on the red dots in this spinning planet to see the role the JPSS satellites have played in major weather events:
California Wildfires
The Visible Infrared Imaging Radiometer Suite (VIIRS) instrument captures natural-color images of fires, like the massive Dixie fire seen here, the second largest in the state’s history. Scientists also use VIIRS data to detect and map fires in remote places like Alaska, where remote-sensing airplanes don’t fly.
VIIRS also contributes measurements to a model called HRRR-Smoke, which simulates the behavior of wildfire smoke–its thickness and movement, both high above the clouds and on the ground. At the surface, fine smoke particles can penetrate deep into the lungs and aggravate a range of health problems, such as asthma and heart and lung disease. Smoke high in the atmosphere can also affect visibility for pilots and block incoming sunlight.
Image credit: NASA Earth Observatory
Hurricane Ida
On August 29, 2021, Hurricane Ida made landfall near Port Fourchon, Louisiana, as a strong Category-4 storm–exactly 16 years after Hurricane Katrina struck the area. Ida brought with it torrential rainfall, flooding and sustained winds as high as 150 mph that tore off roofs, downed trees, damaged whole neighborhoods and snuffed out power to more than a million homes. As it approached landfall. Ida’s wind speed, fueled by unusually warm ocean temperatures, atmospheric moisture, and low wind shear, increased by 65 mph in 24 hours. Its remnants then swept northeast, where it caused devastating flooding in New Jersey, New York, Pennsylvania and Connecticut and led to nearly four dozen confirmed deaths.
The Advanced Technology Microwave Sounding (ATMS) instrument took measurements that provided early warning of this storm. By measuring atmospheric temperature and moisture, as well as sea surface temperatures, ATMS gives forecasters data they need to predict how a hurricane will track, along with its intensity. These data are combined with ground-based observations and weather models, and they help people make important decisions on whether they need to take shelter or evacuate.
Image credit: NOAA
Drought And Heat Waves In The American West
The drought that has gripped the American West since 2000 is the worst the region has seen in at least 1,200 years, according to a recent study in the journal Nature Climate Change.
A product from the VIIRS instrument called the Vegetation Health Index shows vegetation and crop health, represented in color coded maps, like the one seen here. Green and blue indicates lush, healthy growth; red means parched and dry.
This product informs the U.S. Drought Monitor map, which plays an important role in decision-making involving agricultural reimbursements and other government assistance. It is also used regularly by meteorologists at the U.S. Department of Agriculture to monitor global crop growth.
Image Credit: NOAA STAR. The Vegetation Health Index Map shows crop health in the United States on August 5, 2022.
Phytoplankton Bloom
Barents Sea
The JPSS satellite’s VIIRS instrument captures vibrant blue and turquoise swirls, indicating a phytoplankton bloom north of Finland. Phytoplanktons are tiny, microscopic plants that form at the base of food webs in marine ecosystems and thrive in Arctic waters. They are common in this location in late July and August, thanks to a combination of 24-hour sunlight, minimal ice cover and relatively warm surface waters. This image is from the Suomi-NPP satellite.
Image Credit: NOAA. The vibrant blue and turquoise swirls in the center of the image show a phytoplankton bloom north of Finland.
Saharan Dust Storm
Northwest Africa
For several days in February and March 2022, strong winds from the Sahara Desert carried sand and dust east off the coast of Africa, over the Atlantic Ocean and north toward Europe. The Saharan Air Layer, a mass of dry, dusty air that forms over the desert and extends as high as 20,000 feet into the atmosphere, can travel several thousand miles, grounding flights, turning the sky orange and suppressing cyclone development during hurricane season, but also bringing minerals that replenish soil nutrients as far away as the Amazon Rainforest.
The JPSS satellites’ OMPS instruments measure aerosols from the dust plumes, monitoring air quality and visibility for aircraft.
Hurricane Ian
Cayo Costa, Florida
Hurricane Ian, one of the most powerful storms ever recorded in the United States, made landfall to the west of Ft. Myers, Fla., on Sept. 28 as a Category 4 hurricane after causing widespread damage in western Cuba. In Florida, the storm destroyed entire coastal communities and unleashed a dangerous storm surge before moving up the coast, where it made a second landfall in South Carolina on Sept. 30. The storm was responsible for more than 120 deaths, according to state and county officials.
This image, captured by the NOAA-20 satellite on Sept. 27, shows the massive, well-organized storm approaching Florida’s coast.
Hunga Tonga-Hunga Ha-Apai Volcanic Eruption
When the Hunga Tonga-Hunga Ha’apai volcano massively erupted on Jan. 11, 2o22, it unleashed a plume of ash and smoke that spewed more than 20 miles into the atmosphere, sent a shockwave around the world and triggered a tsunami that devastated parts of the Pacific island nation of Tonga.
As JPSS satellites passed over the volcano, their Ozone Mapping and Profiler Suite (OMPS) instruments measured sulfur dioxide emissions in the plume spewing from the eruption. The volcanic plume contains particles made of glassy silicate ash and sulfuric acid droplets, as well as gases, both of which are health hazards in high concentrations.
Volcanic clouds can pose threats to aircraft by affecting cabin air quality, damaging the airframe and engines, and reducing visibility.
Image Credit: NASA OMPS processing team. This map shows a stratospheric sulfur dioxide cloud over the Pacific Ocean from January 15, 2022 eruption of Hunga Tonga – Hunga Ha’apai underwater volcano (triangle) near the Pacific Island Nation of Tonga. These measurements were collected on January 17, 2022 by the OMPS instrument on the Suomi-NPP satellite.
Giant Iceberg Breaks Off Antarctica
Western Side Of Ronne Ice Shelf
In May 2021, an iceberg nearly the size of Delaware sheared off from the edge of Antarctica and floated into the Weddell Sea, where it fractured into pieces. The iceberg, named A-76 by the U.S. National Ice Center, measured 1,668 square miles before breaking up.
The VIIRS instrument on the JPSS satellites observed A-76 splitting from the Ronne Ice Shelf on May 15 and 16 during multiple flyovers.
VIIRS can see ice sheets, ice shelves and icebergs, such as A-76, at a high spatial resolution of 375 meters, and the instrument's wide swath and frequent overpasses at the poles resulted in good coverage of this calving event.
VIIRS also plays an important role in mapping and monitoring glaciers, along with measuring the surface albedo and temperature of ice sheets and the ice concentration, thickness, surface temperature and motion of sea ice.
JPSS News
-
Hurricanes, tornadoes, and blizzards are well known for their destructive impact to life and…
-
River flooding poses a serious threat to communities across the United States, endangering roughly…