
This story, originally published on August 30, 2018, has been updated.
On September 10, 2017, Hurricane Irma made landfall in South Florida. One of the strongest storms ever recorded in the Atlantic, Irma left behind a trail of destruction from the Caribbean to the Florida Keys. But thanks to improvements in weather prediction models and data from NOAA satellites, Irma's 5-day track forecasts were remarkably successful, giving communities adequate time to prepare for the storm's impacts.
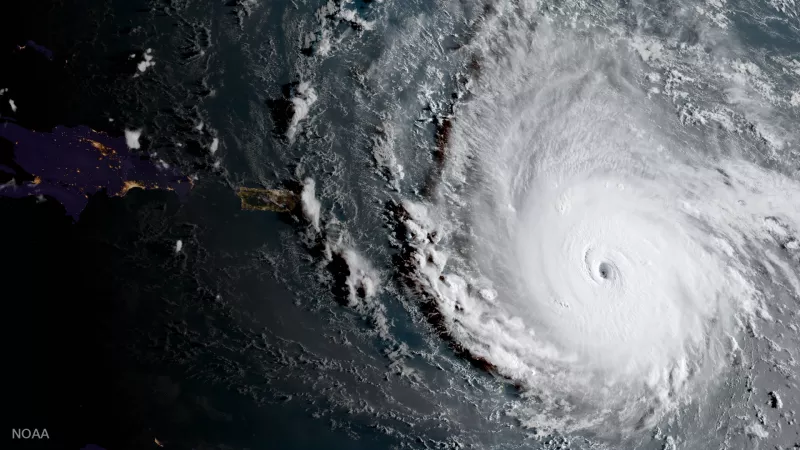
Irma was the strongest hurricane ever observed in the open Atlantic. Only a day after it was first named a tropical storm in the eastern Atlantic Ocean on August 30, Irma had quickly strengthened to a Category 3 hurricane, with sustained winds of 115 mph. Fueled by very warm ocean waters, a moist atmosphere and light surrounding winds that supported its vast circulation, Irma became even stronger as trekked westward across the Atlantic. By September 4, Irma had morphed into a monster Category 5 storm. With sustained winds peaking at 185 mph, Irma set a new milestone as the strongest hurricane ever observed in Atlantic basin outside the Caribbean Sea and the Gulf of Mexico.
Over the next few days, Irma continued moving west, passing through the Leeward Islands and just north of Puerto Rico and Hispaniola, all while maintaining its destructive Category 5 status (defined as sustained winds reaching at least 157 mph on the Saffir-Simpson Scale).
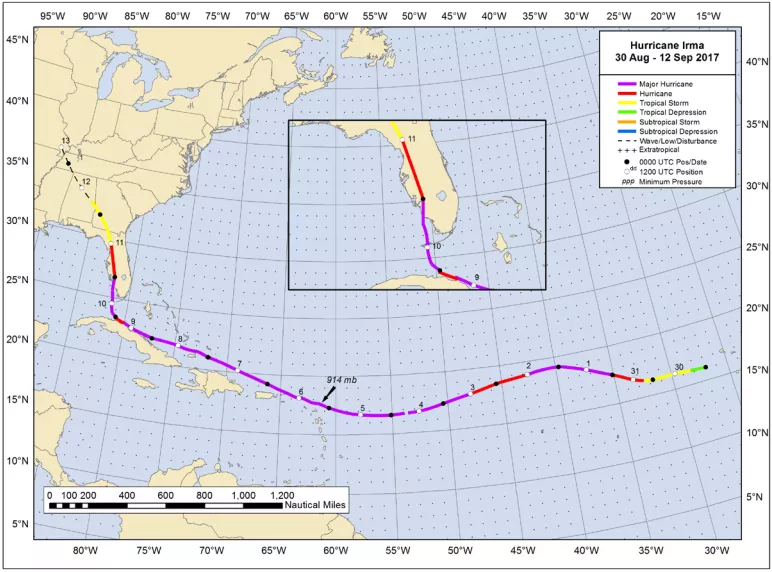
Though the storm began to weaken after grazing the northern coast of Cuba, Irma was still an incredibly powerful storm as it approached the U.S. With 130 mph winds, Irma barreled through the Florida Keys as a Category 4 hurricane, where the resulting storm surge caused water levels to rise 4 to 8 feet above normal. After traveling more than 3,000 miles across the Atlantic, Irma made its last landfall as a formidable Category 3 storm in southwest Florida (at Marco Island) on September 10.
How data helped the forecast
Irma ultimately tracked about 100 miles farther west than some weather models and the National Hurricane Center were predicting days before the storm made landfall. But despite some public discussion about whether the storm’s potential impacts in Florida were overblown, the overall track forecast for Irma was extremely successful.
The graphic below shows that Irma’s actual path (white dashed line) was very similar to the official National Hurricane Center track forecasts (blue dashed lines) issued every 6 hours in the days before Irma reached the United States.
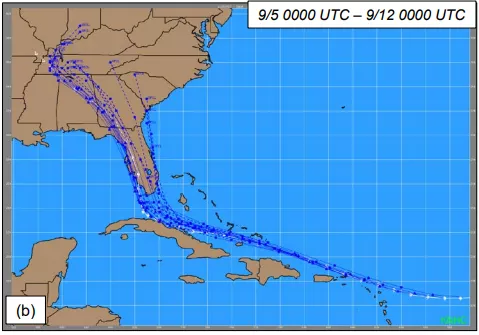
The relatively small errors in the predicted and actual track of Irma are an example of the continued improvement in hurricane track forecasting. A recent report from the National Hurricane Center showed that of the 407 forecasts issued for the Atlantic basin last year, the average track forecast errors in 2017 were the lowest on record – and smaller than the previous 5-year track forecast average.
This success story can be attributed, in part, to improvements in weather forecasting models, as well as the enormous amounts of observational data collected by NOAA satellites–and other sources, such as ocean buoys, hurricane hunter aircraft, weather balloons, and ground stations.
The importance of satellites
We rely on satellite data to predict the path and intensity of powerful hurricanes like Irma. A reanalysis from the European Centre for Medium-Range Weather Forecasts (ECMWF) shows that without data from satellites, we would not have known the initial atmospheric conditions (including humidity levels and wind speed) that allowed Irma to form in the eastern tropical Atlantic.
Weather satellites circling high above Earth provide critical information about our atmosphere, allowing us to predict severe weather many days in advance. While geostationary satellites, such as GOES-16 keep a constant eye on a storm’s movements and convective activity from 22,000 miles away, polar-orbiting satellites, such as NOAA-20 and Europe’s MetOp satellites are what allow us to predict a storm’s future movement and intensity.
These satellites, which circle the Earth 14 times a day from 520 miles away, are equipped with microwave and infrared sounders that collect critical data about a storm’s structure, including wind speeds, atmospheric temperature, humidity, and air pressure. Millions of data points are then fed into powerful supercomputers that produce simulations of a storm's future path. These weather forecasting models are used to develop 5 to 7-day weather forecasts.
In the case of Irma, computer-based simulations used to predict Irma’s track were remarkably consistent over a week-long period. Both the Global Forecast System and the European model predicted Irma to move northwestward, passing north of Puerto Rico and Cuba before curving northward into the Florida Peninsula. The consistency of Irma’s track forecast allowed Florida to declare a state of emergency an unprecedented six days in advance, providing ample time for residents to prepare for the storm’s impacts.
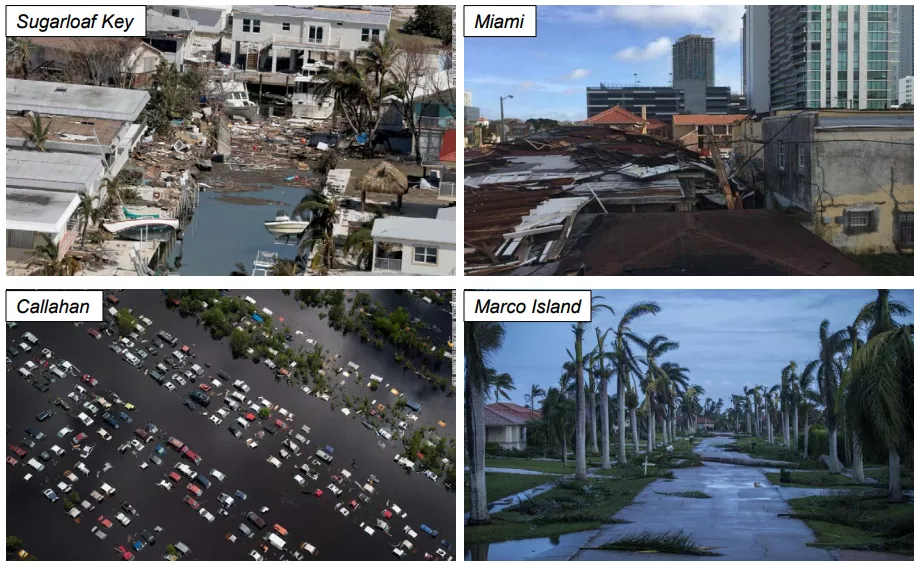
Although Irma weakened as it approached the Florida Peninsula, the storm's strong winds and heavy rain still caused $50 billion in damage in the U.S. alone. Irma's impacts were severe in the Florida Keys, where many homes were destroyed or left uninhabitable. However, because Irma ultimately hit Florida as a slightly weakened storm, and in a less populated part of the state, Irma spared Florida from an even more catastrophic impact.
The National Hurricane Center’s ability to issue consistent forecasts days ahead of time highlights how much hurricane track forecasting has improved over time. More powerful supercomputers, combined with advancements in high-resolution satellite data and observations, are improving our ability to prepare for storms like Hurricane Irma and other extreme weather events.