
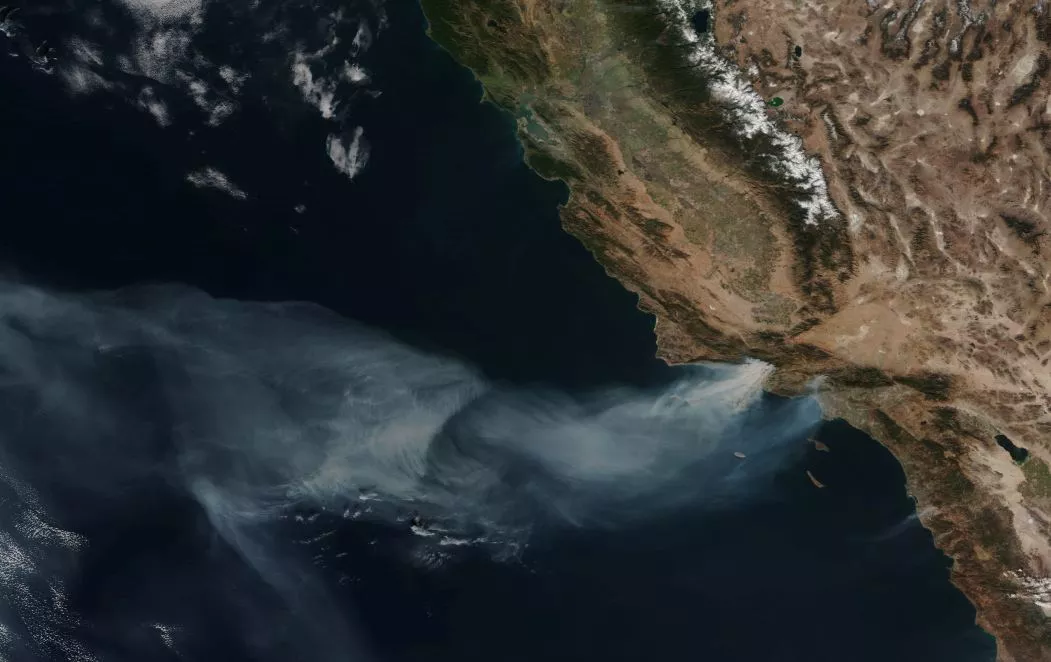
his December 6, 2017, true-color image from Suomi NPP’s VIIRS instrument shows large plume of smoke drifting out over the Pacific, pushed by the strong Santa Ana winds.
Several large fires continue to burn in California—the nearly 7,000-acre Rye Fire (90% contained), the 4,100-acre Lilac Fire (80% contained) and the largest, the 230,000-acre Thomas Fire (5% contained). According to CALFIRE, the Thomas fire began on December 4, 2017 at approximately 6:30 pm and has since displaced tens of thousands of people. As of December 11, the fire has destroyed almost 800 structures and damaged 185 more.
More than 6,000 personnel are working to extinguish the blaze and, more may be needed as the fire continues to grow. Information released by CALFIRE on 12/11 notes that, “Severe fire weather will continue to promote significant growth [of the Thomas fire] further into Santa Barbara County…. Gusty Santa Ana winds will continue to push fire to the west, while very low fuel moistures, high temperatures and single-digit relative humidity will support fire growth on the west and north sides. Extreme fire behavior will continue to hamper control efforts.”
As firefighters respond to this emergency, the Joint Polar Satellite System’s Suomi NPP satellite has been capturing imagery (see below) showing the location and growth of the Thomas and other fires. In addition, instruments on Suomi NPP also collect data that is incorporated into weather models that can forecast the movement and atmospheric concentration of smoke produced by these conflagrations.
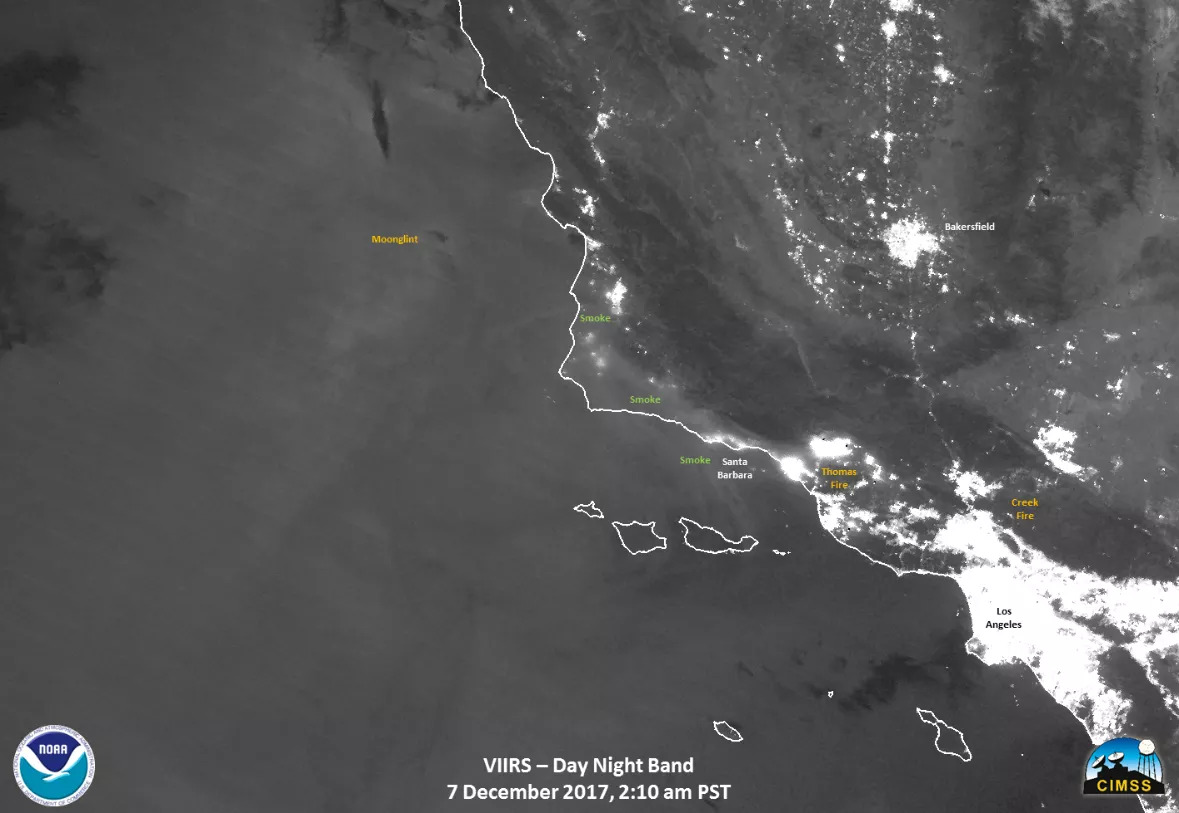
This Day/Night Band image produced by the Visible Infrared Imaging Radiometer Suite (VIIRS) instrument aboard Suomi NPP shows the locations of the Thomas and Creek fires (and their smoke) on the morning of December 7, 2017. Day-Night band imagery from Suomi NPP helps identify fire boundaries and smoke movement at night where other data sources are very sparse.
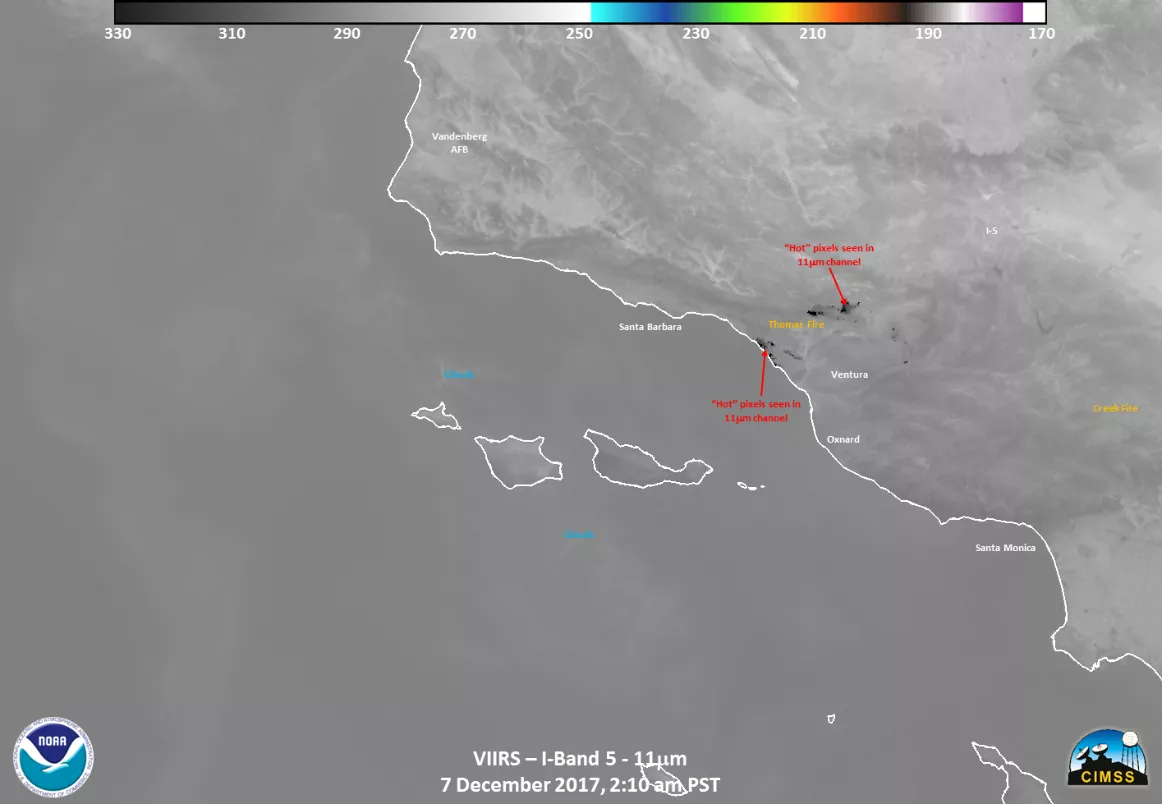
VIIRS’s longwave infrared band (Band I-5) detects thermal radiation from the Earth. This particular channel can provide an estimate of the temperature the surface is emitting in clear regions. Because the Thomas fire is such an intense fire, it can appears black, indicating temperatures that are close to 330 K (~134 oF) to 380K (~225 oF), whereas the surrounding surface, which appears gray, are closer to 285 K (~57 oF). Clouds can been seen in the Pacific near the Channel Islands, and appear white since they are cooler than the ocean.
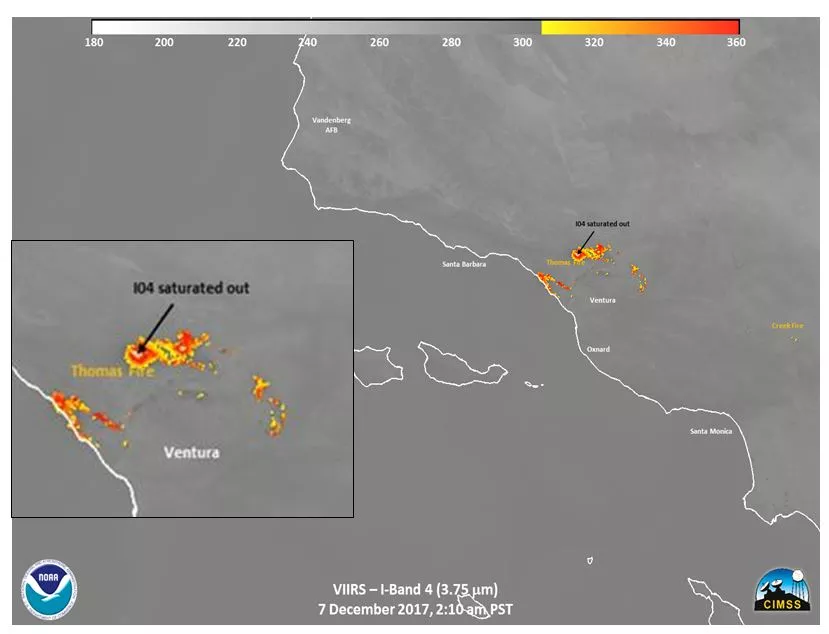
This infrared image from the VIIRS instrument (Band I-4) provides an indication of just how hot the Thomas fire is. The red areas indicate that the fire is burning at temperatures of more than 360 K (or about 185 oF). The gray areas within the fires are areas where the pixel has saturated the sensor for this channel and where fire is burning at greater than 367 K. This can be seen in lower resolution “Fire” channel on VIIRS (Band M-13), shown below.
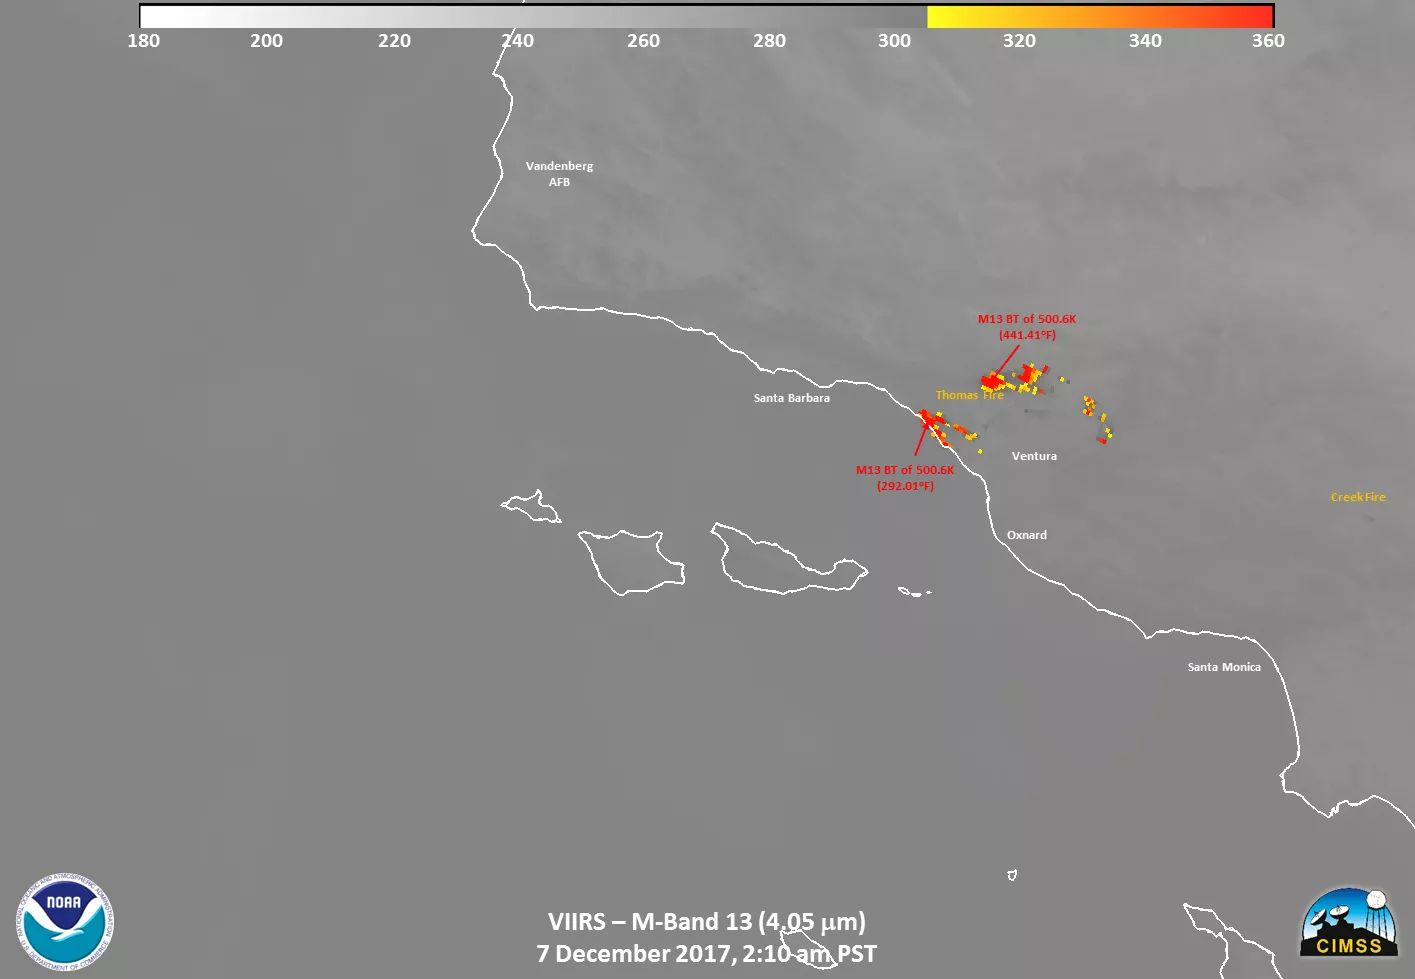
This image shows VIIRS’s “Fire” channel (Band M-13), which is a slightly different channel than the previous one used for fire detection. The brightness of the pixels shows fire temperatures up to 500.6K (441.41oF). The red areas in the hills outside of Ventura and along the coast show where the fire is burning the hottest.
Aside from VIIRS, other instruments aboard Suomi NPP, such as the Advanced Technology Microwave Sounder (ATMS) and the Cross-track Infrared Sounder (CrIS) collect data that used (along with data from other sources) in a variety of weather models, such as the (experimental) High-Resolution Rapid Refresh model, which is used to forecast where smoke from wildfires is likely to travel and in what concentration (milligrams per meter squared). Suomi-NPP input to the HRRR-smoke model has proven to be an important tool for providing accurate forecasts of smoke movement outside the immediate vicinity of a fire.
The JPSS Program Office has worked throughout the 2017 Fire Season to provide a variety of imagery and data, which firefighters and emergency personnel can use to make quick and effective operational decisions in the field. Data from NOAA-20 will soon add even more of this critical data to benefit actions taken to safeguard life and property.