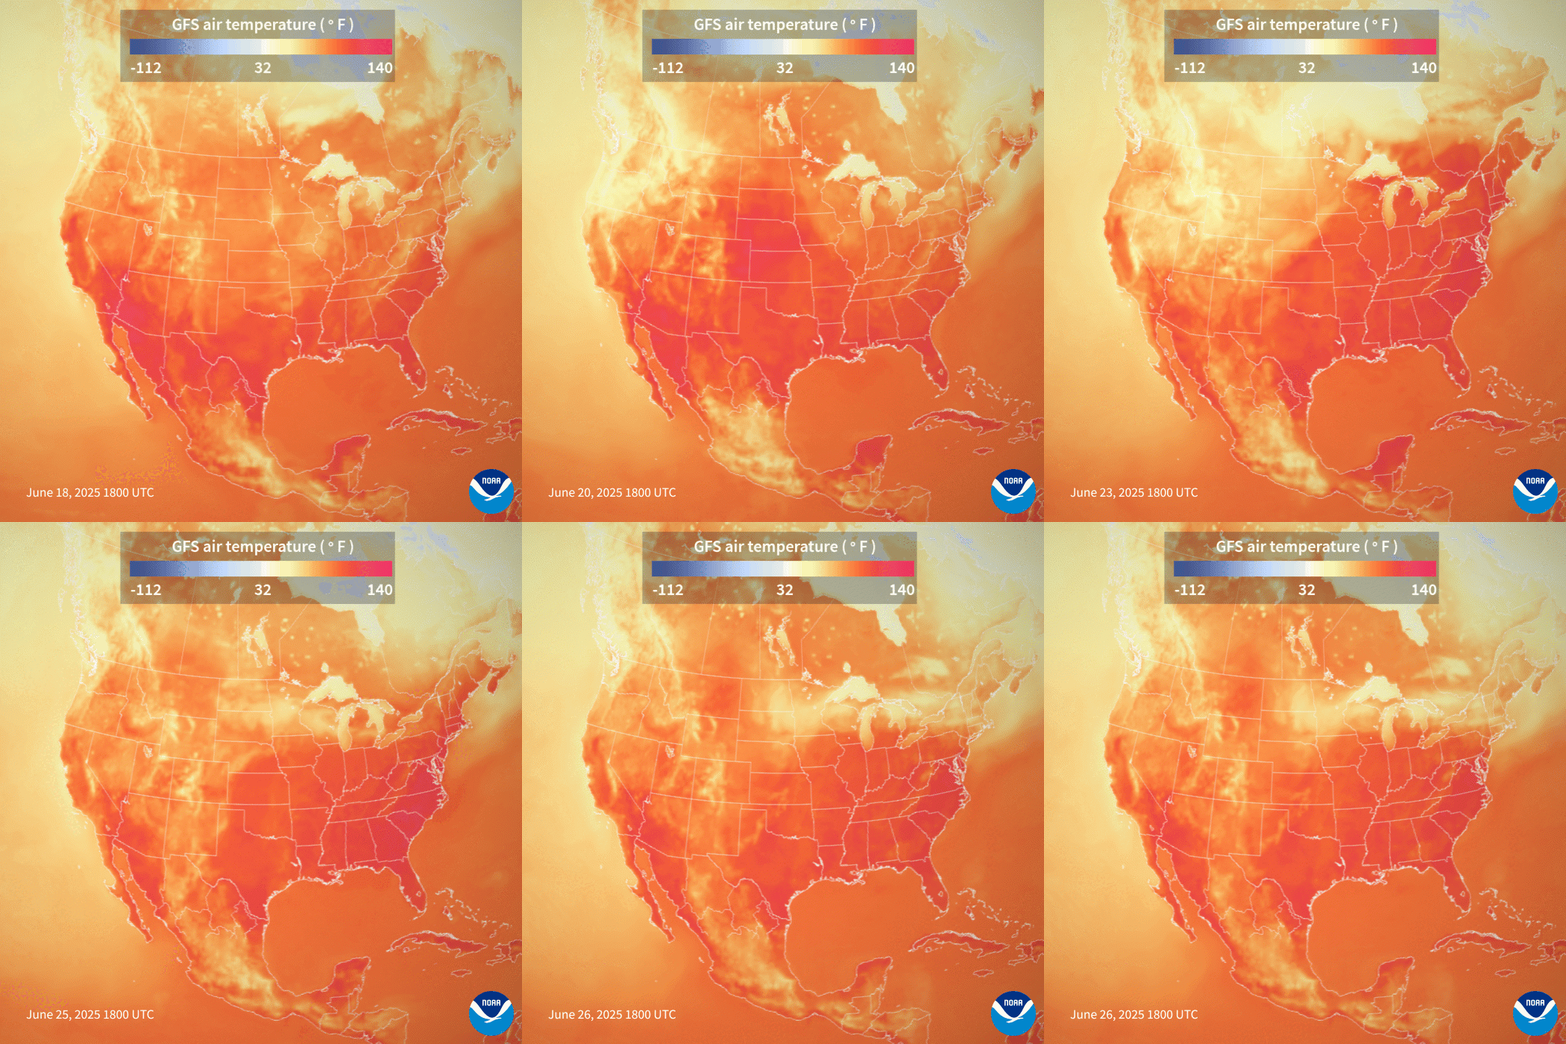
Phenomena: Extreme Heat
Satellite: Joint Polar Satellite System (Suomi-NPP, NOAA-20, NOAA-21)
Product: Surface Air Temperature
Data Used: NOAA Global Forecast System
Timespan: June 18–26, 2025 (each image from 18:00 UTC/2:00 p.m. ET)
Since last week, scientists at NOAA have been monitoring a sweltering and record-breaking heat wave that has been sweeping through the Midwest and eastern United States using NOAA’s Global Forecast System (GFS) model. This model utilizes data from the Joint Polar Satellite System (JPSS) satellites to provide short and long-term weather forecasts.
The animation above shows the air temperature (at two meters above ground) from the GFS model. Pink and orange areas are hot; yellow areas are mild-to-warm; and a distinct transition to blue occurs at the freezing point (32 degrees F or 0 degrees C).
The event was driven by a heat dome, which occurs when a large, persistent area of high-pressure forces the jet stream northward and traps heat close to the ground in areas under the high pressure. Sometimes these heatwaves can last for days to weeks as sinking air traps the heat like a lid on a pot.
As of June 26, 2025, the heat wave was beginning to subside. Yet, heat advisories still covered much of the Ohio and Tennessee Valleys as well as the Middle and Lower Mississippi Valley. For more preparedness information, including the signs and symptoms of heat exhaustion and heat stroke, visit the NWS Heat Safety Website.
NOAA’s Joint Polar Satellite System (JPSS) is the Nation’s advanced series of polar-orbiting environmental satellites and is a collaborative effort with NASA. JPSS represents significant technological and scientific advancements in observations used for severe weather prediction and environmental monitoring. This data is critical to the timeliness and accuracy of forecasts three to seven days in advance of a severe weather event.
For more preparedness information, including the signs and symptoms of heat exhaustion and heat stroke, visit the NWS Heat Safety Website.
