
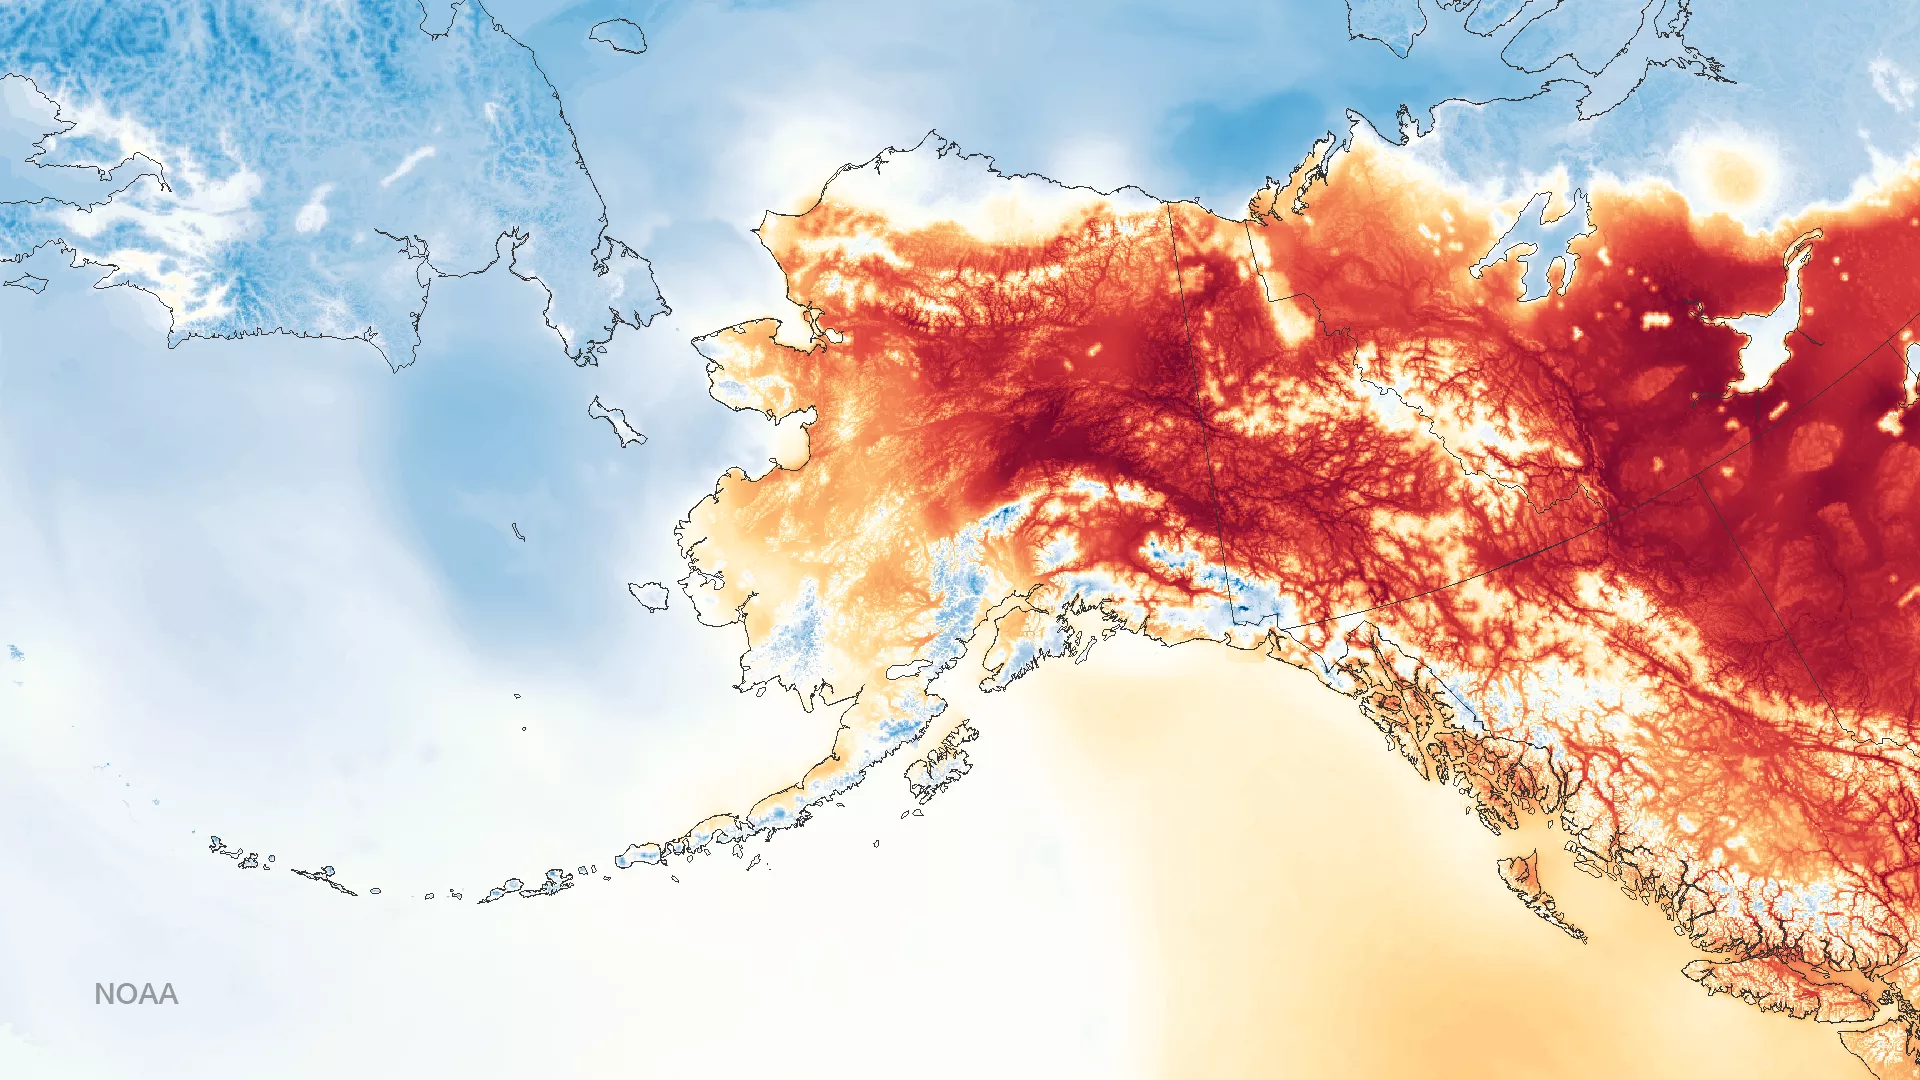
With a total area of more than 660,000 square miles, Alaska is not only the largest state in the U.S.; it's the largest state in the U.S. by far! Not only is it twice the size of Texas, it's larger than Texas, California, and Montana combined! Alaska also has a diverse landscape, with mountains, valleys, coastline, and tundra, featuring dramatic changes in topography. Yet, as large and wonderful as the Alaska is, its immensity and varied landscape create certain challenges for the people who live there. Among them is forecasting the weather.
"The areas of responsibility for forecasters in Alaska's National Weather Service forecast offices are large, compared to those of other areas of the country, and topographically complex," said Eric Stevens, meteorologist at the Geographic Information Network of Alaska (GINA) at the University of Fairbanks and one of the JPSS Program's satellite liaisons. "The terrain can modify synoptic (aka: large)-scale weather patterns to produce highly specific local weather effects. This is important because, if you're going to forecast the weather, you first have to know what's happening now."
To get the information they need to produce accurate weather forecasts, meteorologists and forecasters in Alaska rely on the same tools their counterparts use across the lower 48: ground-level data from weather stations, radar, vertical atmospheric soundings from instruments attached to weather balloons, and imagery and data from earth-observing satellites. What's different in Alaska, though, is that the state's size and diverse topography limit the amount of much of this data.
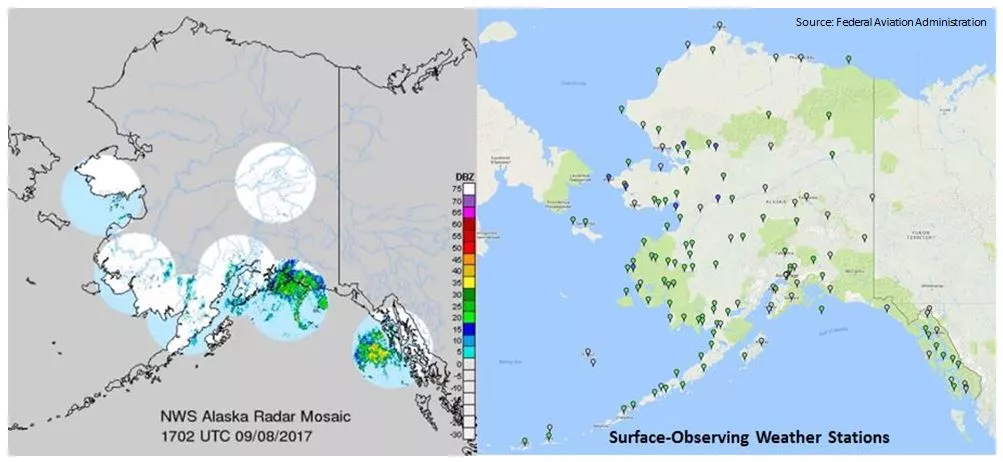
"In Alaska, if you want to look at the radar or balloon networks, you have a real problem with the density of observation and the limited spatial representation of these platforms," Stevens said. "Look at the radar networks in Alaska. We have 7 radars, which is great to have, although six of them are oriented to track landfall-making coastal storms. In the interior of Alaska there is not much radar data."
The same can be said for the use of surface weather stations in the state. Even though they far outnumber radars in Alaska (see graphic below), large portion of Alaska's interior remain relatively uncovered.
Polar-Orbiters Pick Up the Slack
Fortunately, Alaska's size and terrain are not impediments to one important observational tool: polar-orbiting satellites. Often called the "backbone" of global weather forecasting, polar-orbiting weather satellites provide as much as 85 percent of the data used by numerical weather models, making them vital for 3- to 7-day forecasts the world over.
In addition to the value of this data to forecast models, polar orbiting satellites are critical to meeting Alaska's short term forecast challenges. Alaska's latitude and proximity to the North Pole result in its frequent scanning by NOAA and NASA-operated polar-orbiting satellites, as well as those operated by other space fairing nations and organizations around the world (e.g., China, EUMESAT). More frequent scans results in more data for Alaska's meteorologists to use in developing forecasts.
To capitalize on these frequent scans, GINA has two direct broadcast antennas that track and receive data from polar-orbiting satellites. GINA also collaborates with NOAA's cooperative institutes, such as the Cooperative institute for Meteorological Satellites Studies (CIMSS) at the University of Wisconsin. CIMSS created the algorithms that GINA uses to (quickly!) process raw satellite data into something that the meteorologists in the National Weather Service's Alaska forecast offices can use.
"Even the best satellite product does not help a forecaster or the forecast process if the imagery is available after the fact. We can get an image in front of a NWS forecaster within approximately 15 minutes of our contact with the satellite as it passes overhead. That is pretty efficient—and that helps the NWS forecasters do their jobs." The recently launched NOAA-20 will help maintain this efficiency as both it and its predecessor—Suomi NPP—circumnavigate the Earth in the afternoon orbit. Separated in time and space by just 50 minutes, NOAA-20 will provide GINA with even more data (until Suomi NPP is no longer operational) than it's getting now.
The information presented here came from, "It's Dark in Alaska, but the Future of JPSS Is Bright," a presentation given by Eric Stevens on December 18, 2017.
Postscript: Covering Alaska Day and Night
In addition to being large and possessing a challenging landscape, Alaska is also dark, particularly in the winter. (For example, the Alaskan town of Utqiagvik, formerly known as Barrow, —the state's northernmost settlement— will be shrouded in darkness for 67 days this winter.) The satellites of the JPSS constellation can be of service in Alaska during this part of the year as well.
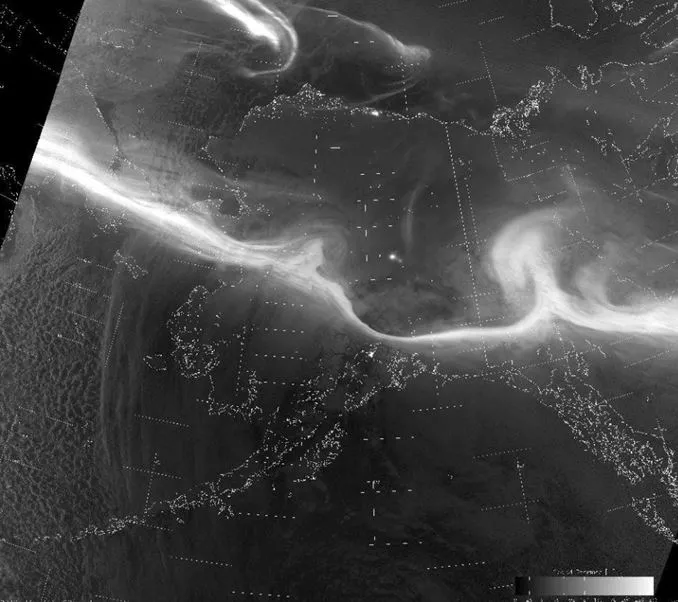
The Visible Infrared Imaging Radiometer Suite (VIIRS) instrument aboard Suomi NPP and NOAA-20 allows the satellite to "see" during nighttime hours using the reflection of moonlight and ambient nightglow—a mix of light from starlight and zodiacal light (sunlight scattered across the solar system by dust particles in space). The Day-Night Band (DNB) is so sensitive it can see not only the weather illuminated the moon, but also anthropogenic light (e.g., city lights), aurorae, and other sources of nighttime light (e.g., fires).
As Eric Stevens notes in this video about the importance of the Day-Night Band for weather forecasting in Alaska, "The Day-Night Band is probably the single most important piece of the VIIRS instrument to the National Weather Service in Alaska. Basically, it allows you to see visible-spectrum light at night. The instrument is so sensitive it's like wearing night-vision goggles. DNB does not show infrared temperatures, but visible light, so if you have any sliver of moon, you can see the weather underneath the moonlight."