
From March 17–18, 2021, a severe weather outbreak swept across the Southern U.S. The storms produced damaging winds, large hail, and dozens of tornadoes, including significant EF2 tornadoes in Mississippi and Alabama. After affecting the Deep South, the storm system then moved eastward and affected portions of Florida, Georgia, the Carolinas, and Virginia, generating additional tornadoes.
Aided by NOAA satellite data, the National Weather Service accurately forecast the severe weather potential in advance to help the public prepare for the hazardous weather event.
On March 13, NOAA’s Storm Prediction Center (SPC) highlighted a large area of severe weather potential. The SPC issued a rare “High Risk” convective outlook on March 17 for portions of Mississippi, Alabama, and Louisiana. Hazards expected during a high-risk outlook include strong, long-track tornadoes, damaging wind gusts, and large hail.
Three “Particularly Dangerous Situation (PDS)” tornado watches were also issued for parts of Mississippi and Alabama on March 17. PDS tornado watches are issued in rare situations when long-lived and intense tornadoes are likely.
NOAA’s GOES-16 satellite (also known as GOES East) tracked the storms in real time, providing vital information. GOES-16 has many capabilities for assessing the threat of severe weather and keeping an eye on evolving storm conditions.
A variety of GOES-16 imagery shows the severity of the storms. Visible imagery from the GOES-16 Advanced Baseline Imager (ABI) provides information about cloud properties, revealing the presence of overshooting tops, gravity waves, and above-anvil cirrus plumes, which indicate a storm may be severe. Infrared imagery provides information on the temperature of the cloud tops. The colder the cloud top, the more likely the storm is producing heavy rain and severe weather.
Combining visible and infrared data into one image is called “sandwich” imagery. During data processing, the transparency of the infrared data is increased and laid on top of the visible data. The result is multi-dimensional imagery that offers spectacular views of storm attributes in rich detail. The mix of visible data and temperature from infrared imagery help identify key formations in a storm. The green, yellow, orange and red areas in this animation show the temperatures of cloud tops within the storm. Dark red areas are colder cloud tops, which indicate areas of greater storm intensity.
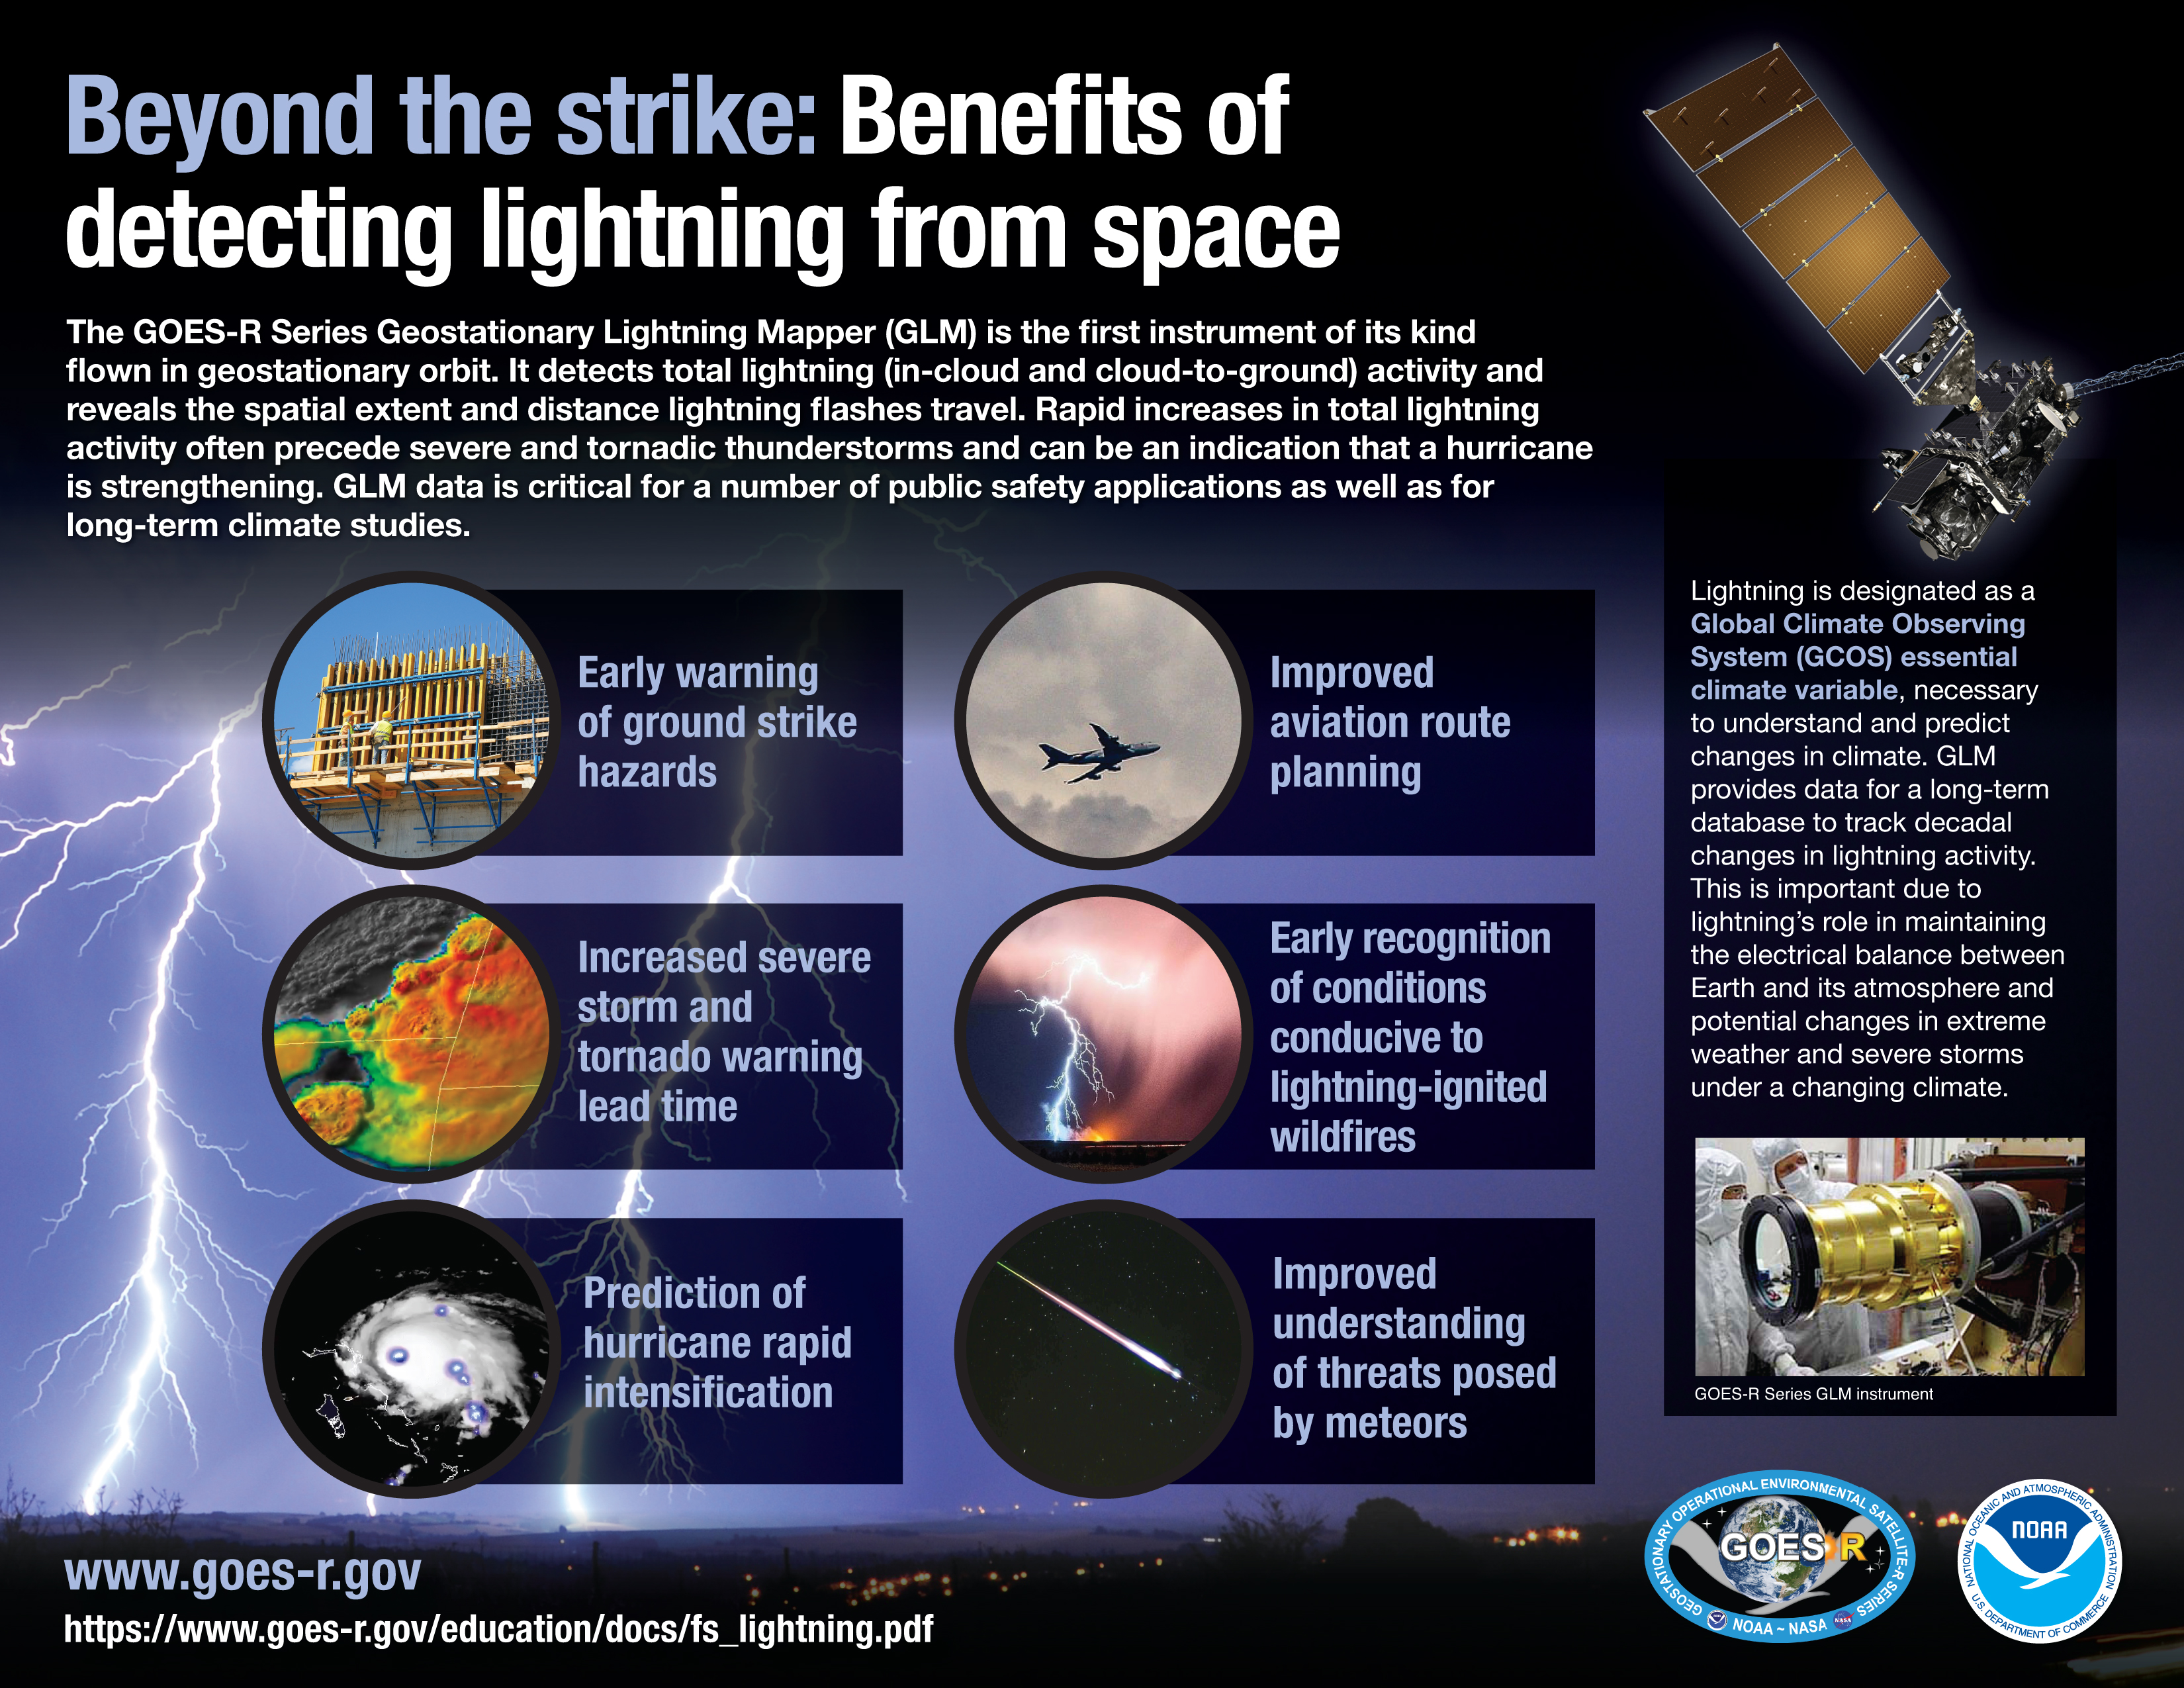
GOES-16 also carries the Geostationary Lightning Mapper (GLM), the first instrument of its kind flown in geostationary orbit. GLM detects total lightning (in-cloud, cloud-to-cloud, and cloud-to-ground) activity and reveals the spatial extent and distance lightning flashes travel. Rapid increases in total lightning activity often precede severe and tornadic thunderstorms. GLM data can help alert forecasters that a storm is intensifying.
Adding a GLM overlay to the ABI imagery provides even more information. The GLM imagery shows significant lightning activity within the storms. GLM data can help forecasters identify initial thunderstorm development and focus on potentially severe storms before those storms produce damaging winds, hail, or even tornadoes. GLM also provides new insights on the duration and extent of individual lightning strikes. Lightning can travel hundreds of miles before striking the ground. GLM can show forecasters areas far from the main line of storms where the risk of lightning strikes to the ground presents a public safety hazard.
Together, the GOES-16 ABI and GLM provide complementary information to help identify potential severe weather and track rapidly changing weather conditions.