
This data visualization shows the maximum wind gusts from Hurricane Irma from September 7 to September 10, 2017. Note how the strongest wind gusts are on the north side of the storm track (the faint dotted line). According to the NOAA's National Hurricane Center, Irma's maximum sustained winds ranged from 110 (on 9/10) to near 180 (on 9/7) miles per hour during this period. This graphic was created with data from the RTMA, which uses surface observation data to create a highly accurate gridded analysis of past weather conditions. The data covers only the Continental United States and coastal areas, so areas of the storm further to the south and east, where Irma was at maximum intensity, are not visible
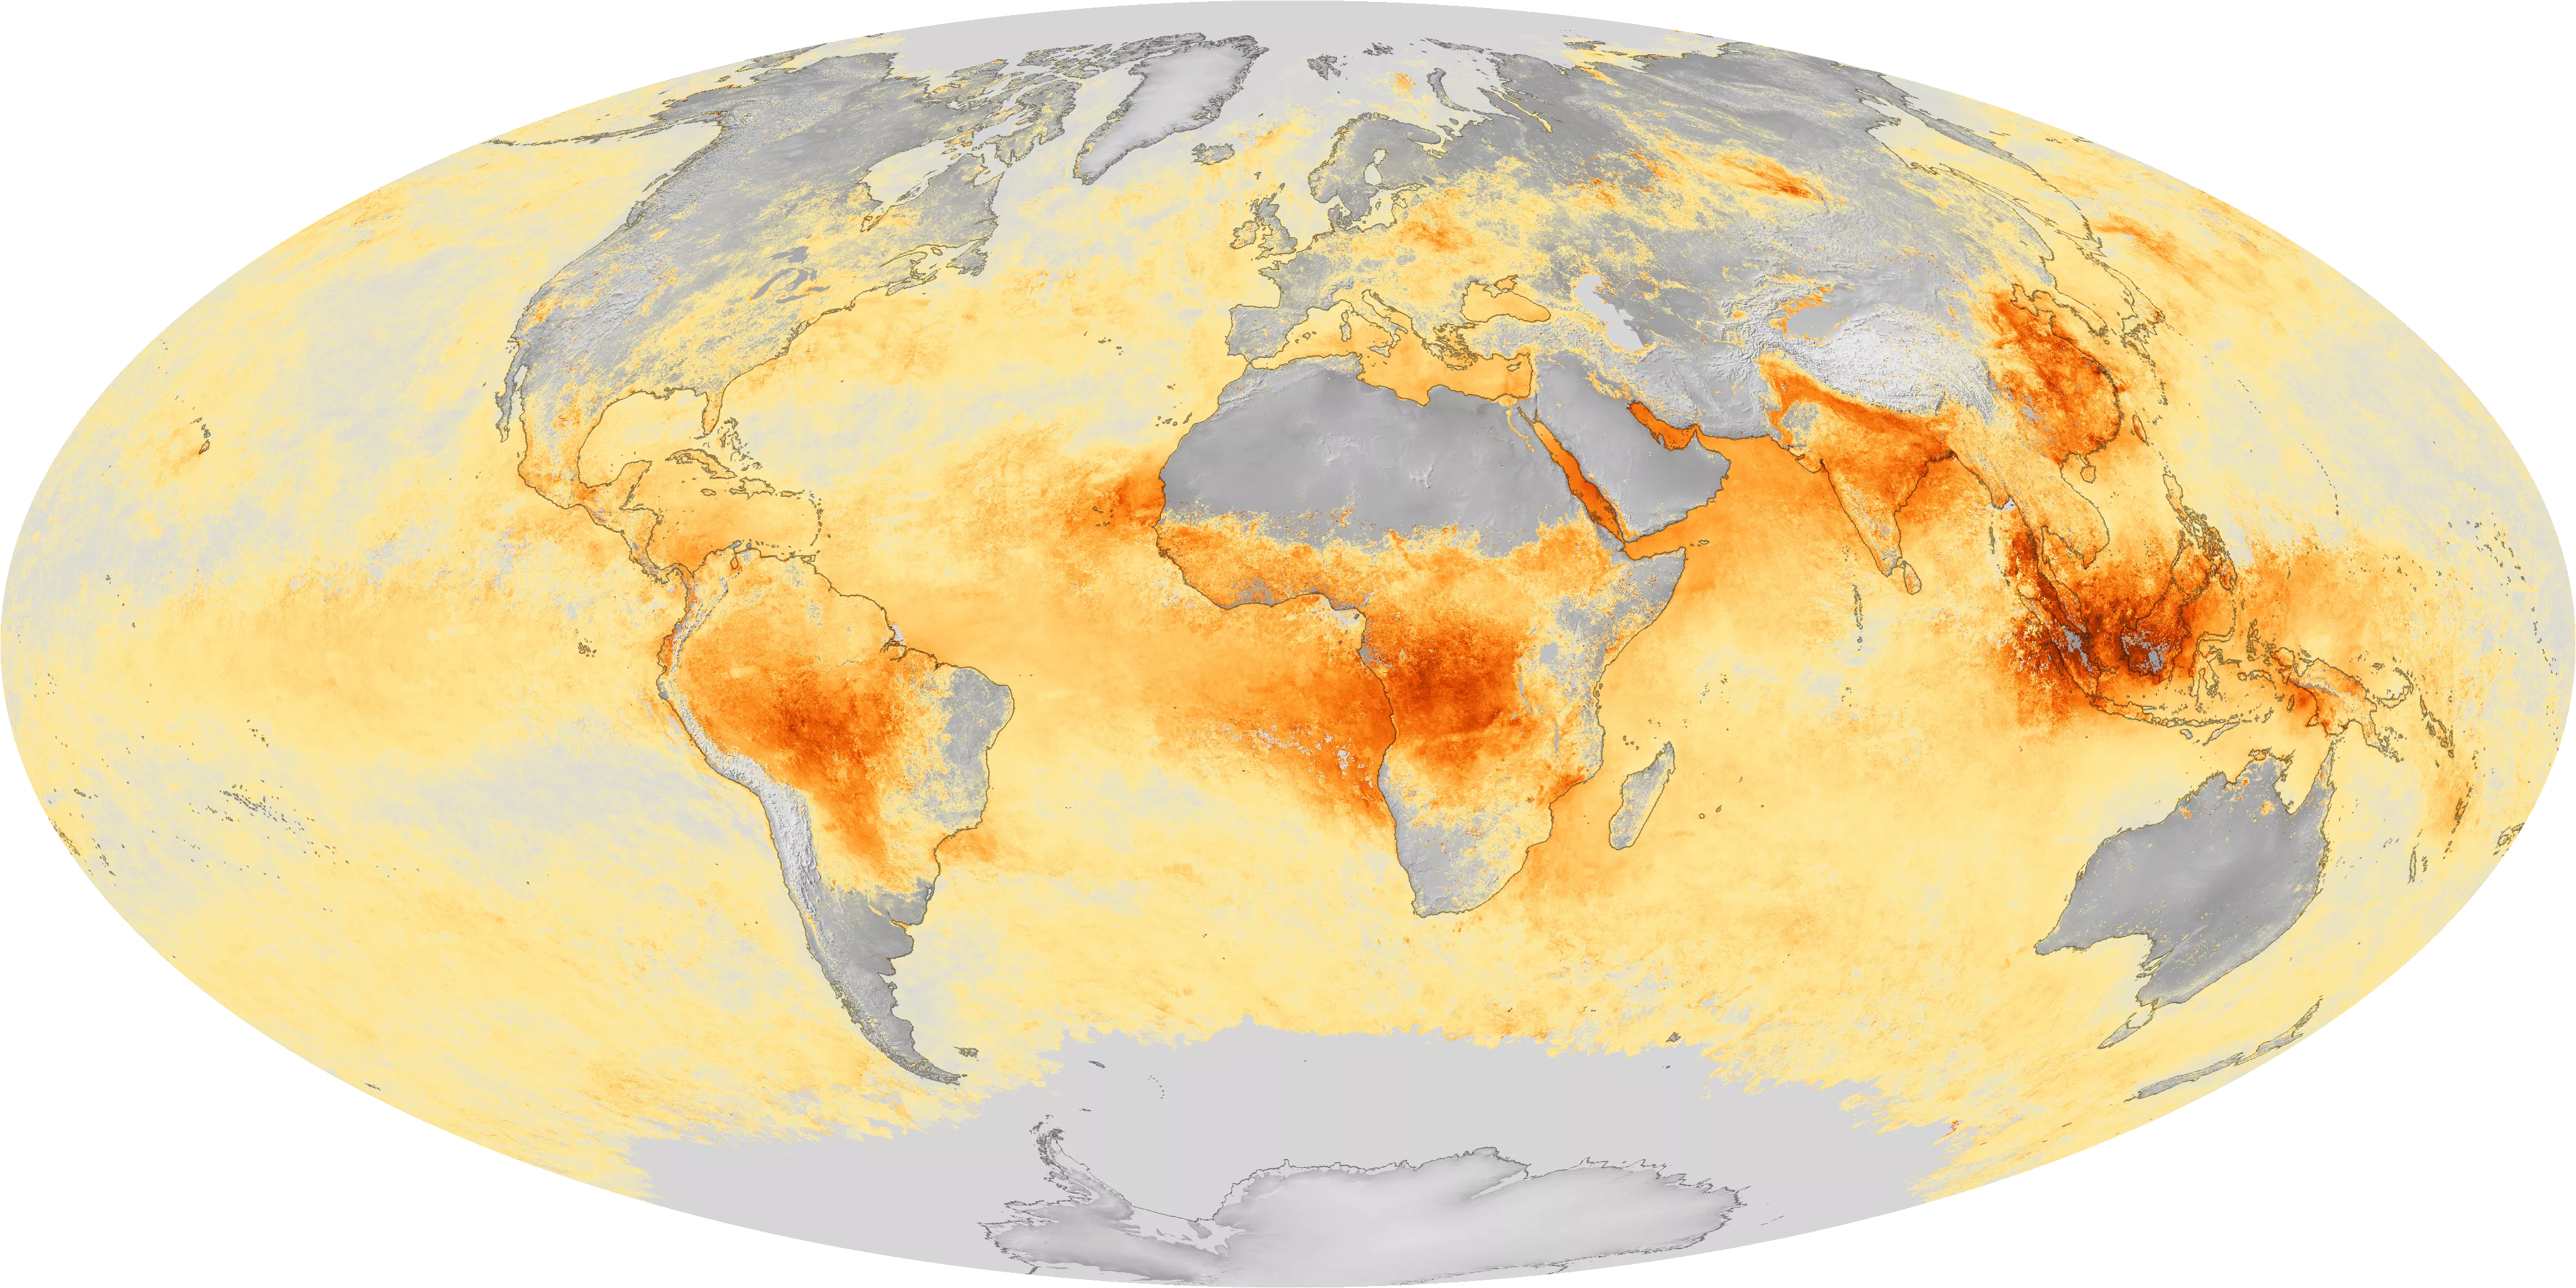
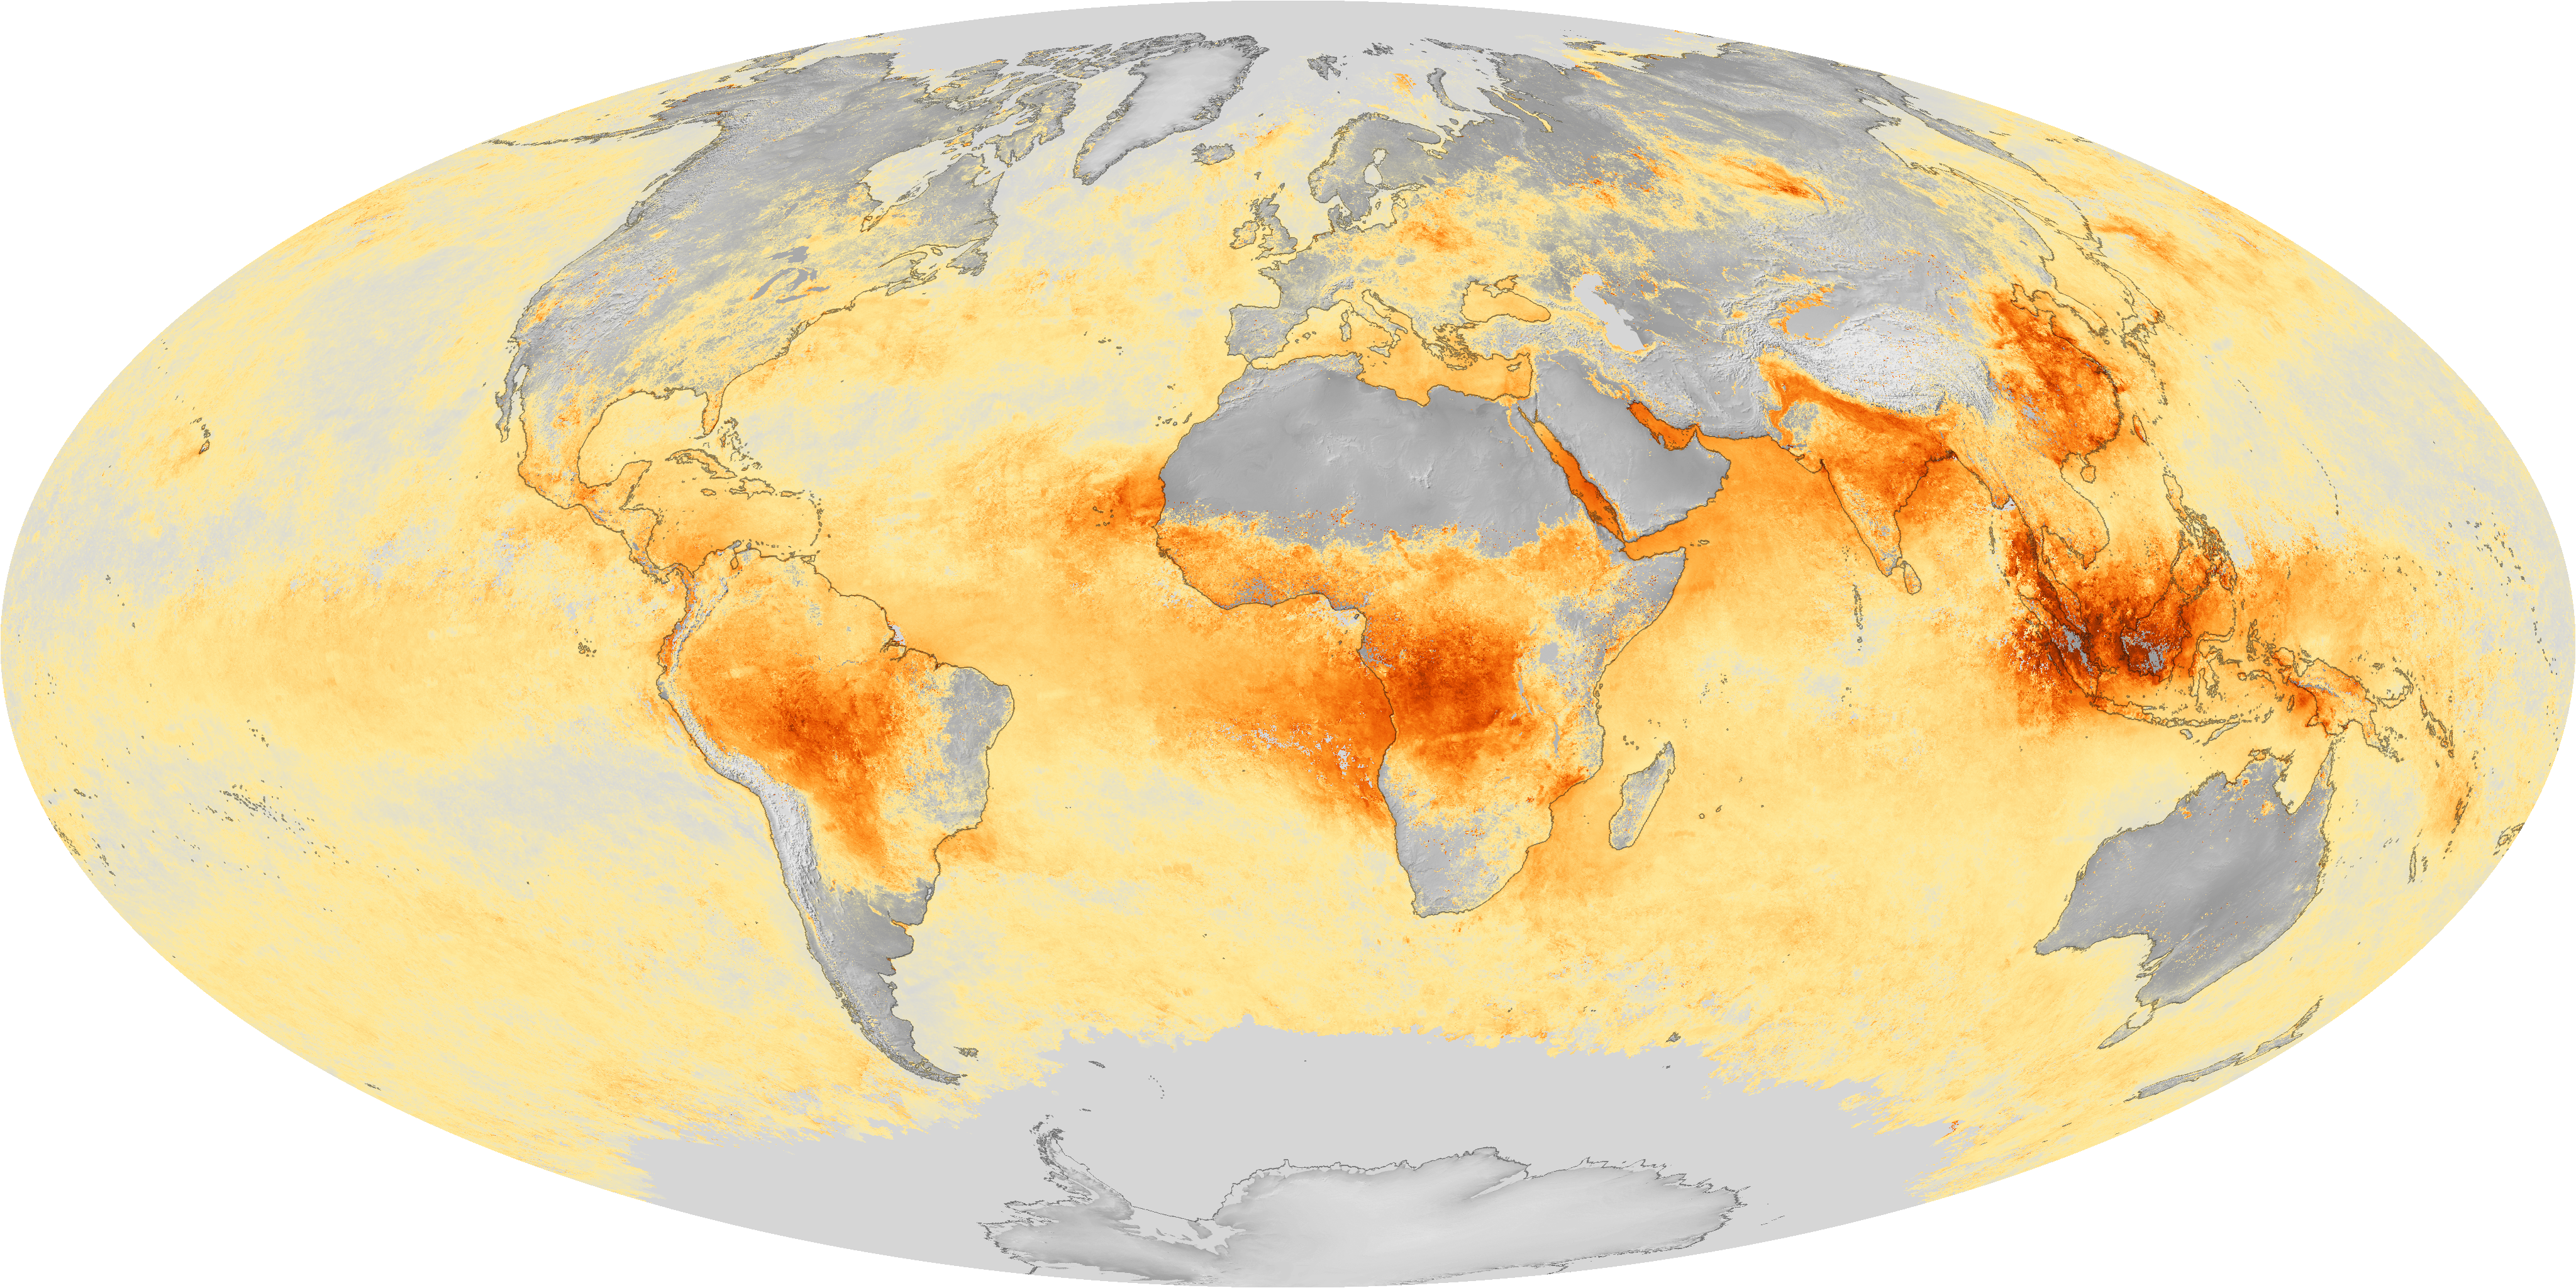
Aerosols are fine particles produced by the burning of fossil fuels, wildfires, pollution, and even dust and sandstorms suspended in the atmosphere, and the JPSS satellite’s VIIRS sensor can detect their concentration in the atmosphere by measuring the amount of sunlight they reflect back into space. This image shows the monthly average aerosol optical thickness around the globe. Notice the high concentrations of aerosols around western Africa, Brazil, India, Southeast Asia, and the Indo-Pacific -- areas with high rates of deforestation, frequent agricultural burning and wildfires, and pervasive air pollution.