
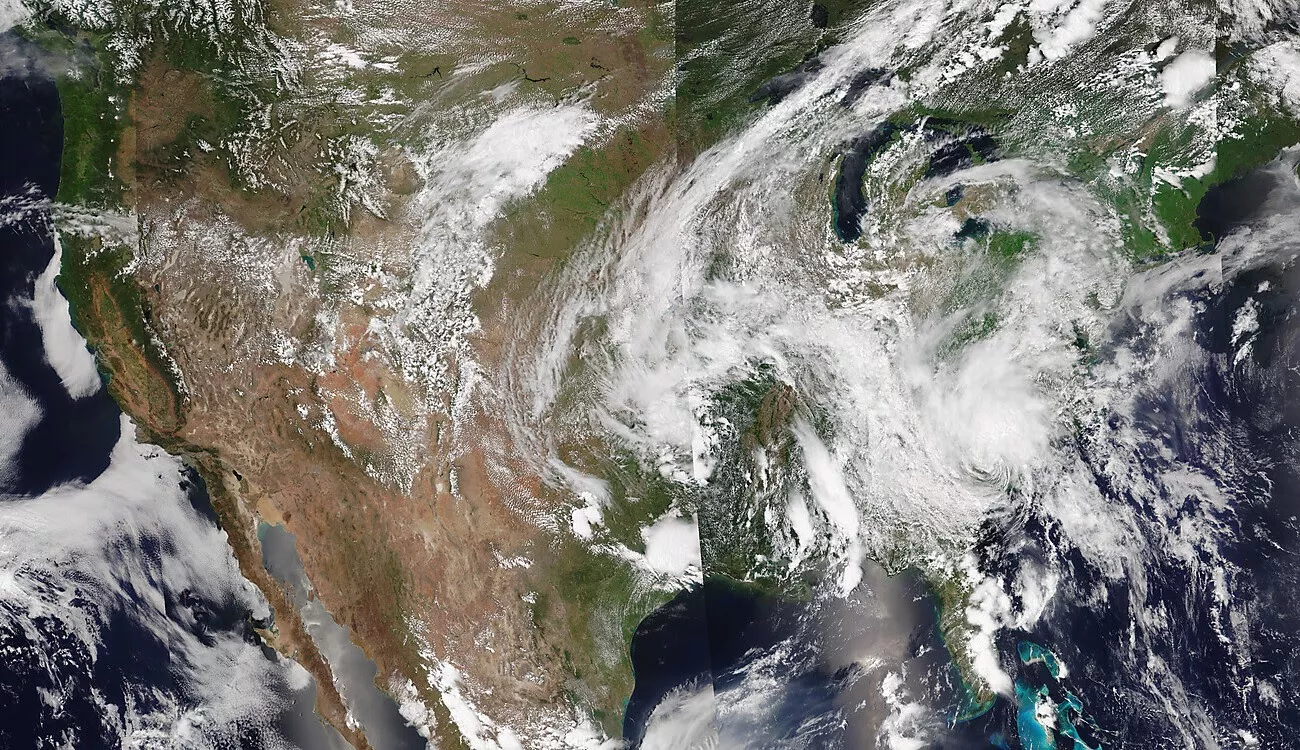
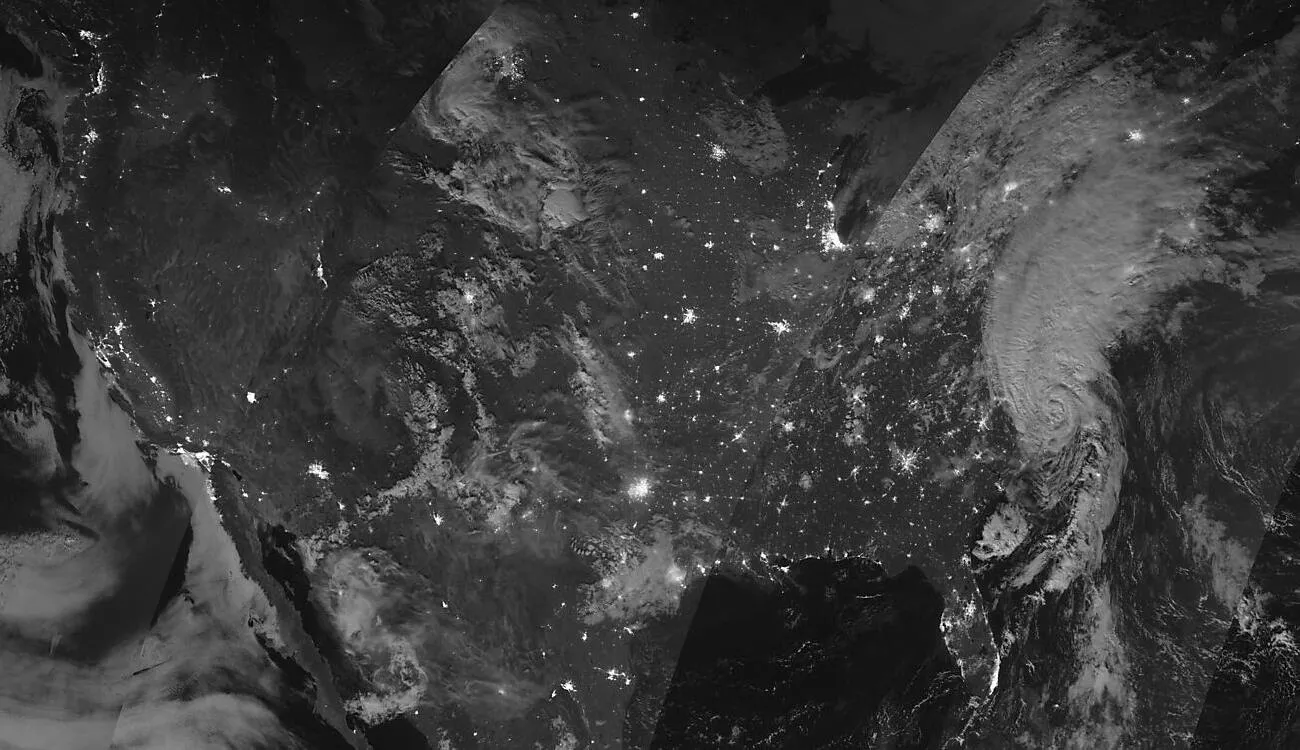
NOAA satellites provide critical information for forecasting and tracking tropical storms and hurricanes

Atlantic hurricane season got off to an early and busy start this year and has been breaking records along the way. On August 6, NOAA issued its updated 2020 Atlantic Hurricane Season Outlook, predicting the possibility of an “extremely active” Atlantic Basin hurricane season. So far, the 2020 season has indeed been an active one, with ten named storms through August 13. In fact, 2020 is shaping up to be one of the most active Atlantic hurricane seasons on record.
Let’s review the 2020 season so far as seen from NOAA’s fleet of Earth-observing satellites:
May
Hurricane season doesn’t officially begin until June 1, but May brought two named storms. This is the sixth year in a row that a named storm has formed before June.
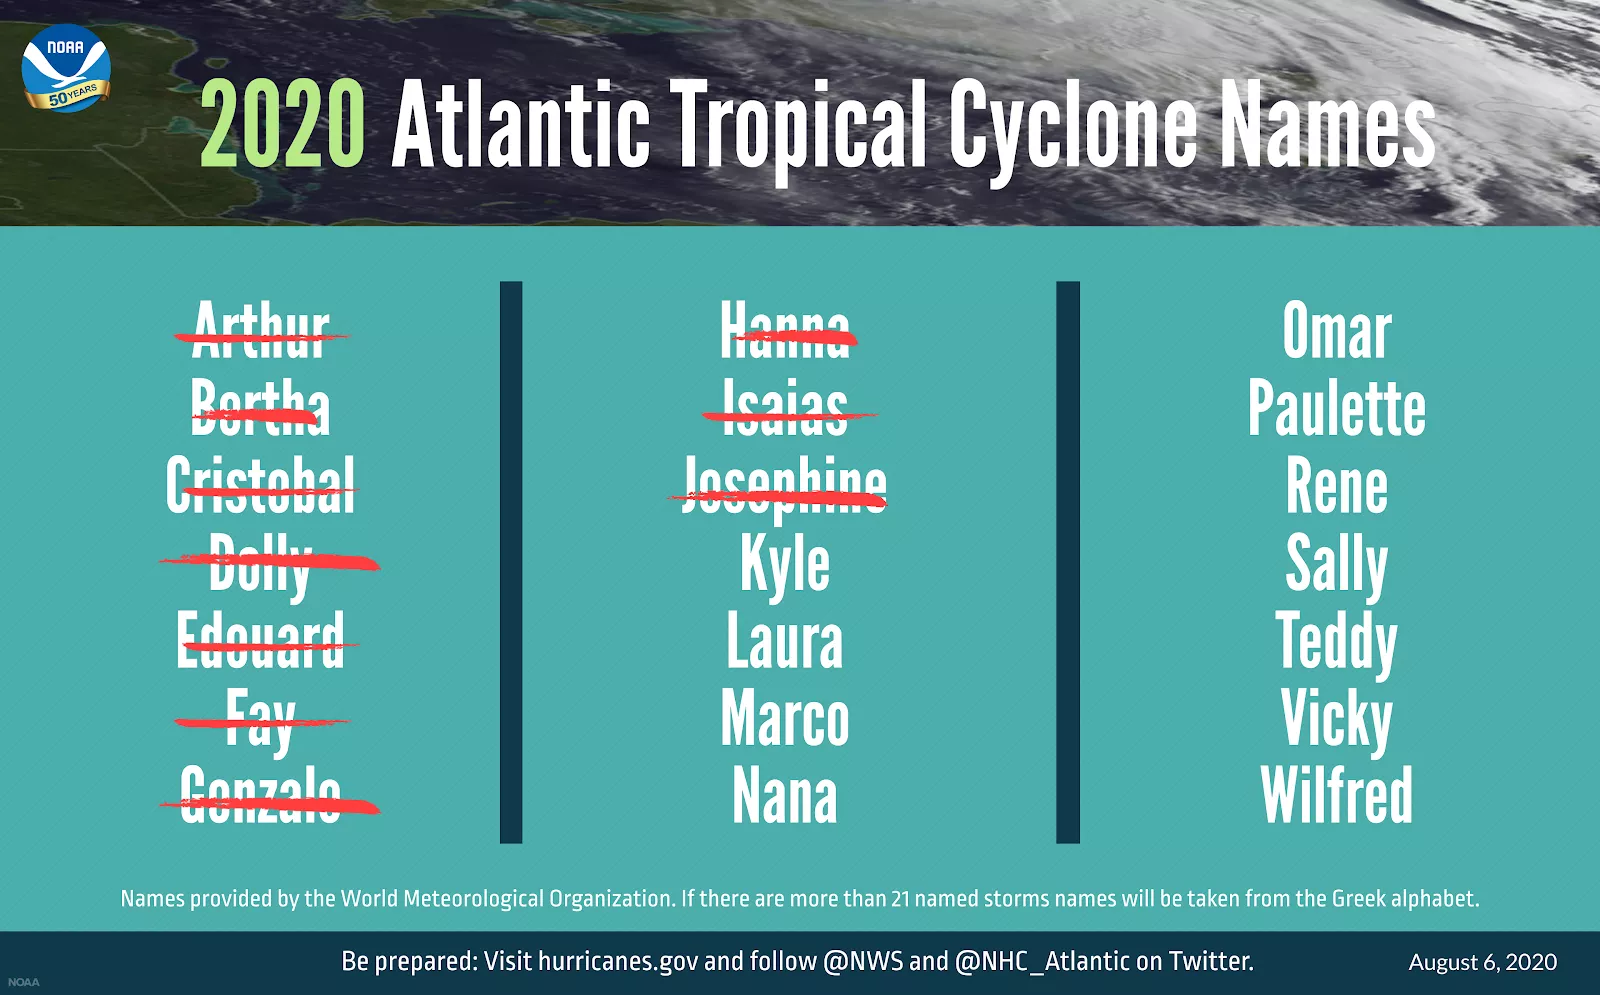
Tropical Storm Arthurformed on May 17, becoming the first named storm of the 2020 Atlantic hurricane season. On May 27,Tropical Storm Berthaquickly developed and made landfall to the east of Charleston, South Carolina, in less than two hours. This was only the sixth time since 1851 that two named storms formed before June 1.
June
June added two record-breaking tropical storms, making the 2020 seasononly the third time on record that four named storms developed in the Atlantic before the end of June. The other two years were 2012 and 2016.
Tropical Storm Cristobal, which formed over the southwestern Gulf of Mexico on June 2, set a record as the earliest incidence of a third-named-storm in the Atlantic basin. Cristobal went on to break other records. After making landfall in Southeast Louisiana on June 7, the remnants of Cristobal entered Wisconsin on June 9. This was the farthest northwest a tropical system has traveled in North America and the first that crossed Lake Superior since records began in 1850. It also had the lowest pressure ever (988 millibars) recorded in Madison, Wisconsin, in June. The previous record was 990.2 millibars on June 1, 1936.
On June 23,Tropical Storm Dollyformed in the North Atlantic, about 370 miles south-southeast of Halifax, Nova Scotia. Dolly formed farther north than any tropical storm on record.
July
July brought five named storms and the season’s first and second hurricanes. The month’s five named Atlantic storms tied 2005 for the most storms during July on record. Each of the storms broke records dating back to the beginning of the satellite era in 1966. Also, in each instance, the previous record was set during the historic 2005 Atlantic hurricane season.
With nine named storms forming by the end of July, the 2020 Atlantic hurricane season set yet another record –the most named storms prior to August since the satellite era began. According to the historical record, the ninth-named-storm does not typically form until October 4.
On July 6,Tropical Storm Edouardformed in the North Atlantic Ocean, several hundred miles south of Newfoundland. Edward was the earliest fifth-named-storm on record, previously set by Hurricane Emily on July 11, 2005.
Tropical Storm Faydeveloped off the coast of North Carolina on July 9. Fay was the earliest instance of an “F†named storm. The previous record was Franklin in 2005. Fay made landfall near Atlantic City, New Jersey, on July 10.
Tropical Storm Gonzaloformed in the Atlantic basin on July 22 and is the earliest "G" storm on record. The previous record was Gert on July 24, 2005.
On July 23,Tropical Storm Hannadeveloped in the Gulf of Mexico, becoming the earliest "H" storm on record. Harvey, which formed on August 3, 2005 held the previous record.Hanna became the first hurricane of the 2020 Atlantic hurricane season on July 25. Hurricane Hanna made landfall on Padre Island, Texas, on July 25 at 5 p.m. CDT with maximum sustained winds of 90 mph. Hanna made a second landfall at 7:15 p.m. in Kennedy County, Texas, again with maximum sustained winds of 90 mph. Hanna brought strong winds, flooding rainfall, an inundating storm surge, and several tornadoes to South Texas.
Potential Tropical Cyclone Nine becameTropical Storm Isaiason July 29. Isaias was the ninth named storm of the Atlantic hurricane season, the earliest such occurrence on record. The previous record for earliest “I” named storm in the Atlantic basin was Irene on Aug. 7, 2005.Isaias became the second hurricane of the 2020 Atlantic hurricane season on July 31.
August
Isaias produced heavy rains and flash flooding across the Dominican Republic, northern Haiti, Turks and Caicos, and the Bahamas, then traveled up the Atlantic coast. Isaias made landfall as a Category 1 hurricane near Ocean Isle Beach, North Carolina on August 3.
On August 13,Tropical Storm Josephineformed as the earliest “J” storm on record. The record was previously held by Tropical Storm Jose on August 22, 2005.
What’s in store for the remainder of the 2020 Atlantic hurricane season?
To date,there have been ten named storms and two hurricanes. Historically, only three named storms form on average by mid-August. An average hurricane season produces 12 named storms, of which 6 become hurricanes, including 3 major hurricanes.Historically, Atlantic hurricane season peaks from mid-August to late October. So what can we expect for the remainder of the season?
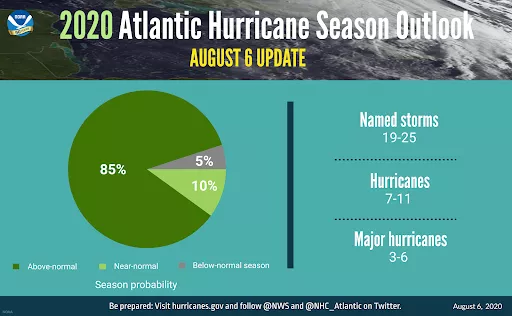
On August 6, NOAA issued its updated 2020 Atlantic Hurricane Season outlook. Originally calling for a 60% chance of an above-normal season, a 30% chance of a near-normal season and only a 10% chance of a below-normal season, the updated outlook increased the likelihood of an above-normal Atlantic hurricane season to 85%, with only a 10% chance of a near-normal season and a 5% chance of a below-normal season.
NOAA is now predicting19-25 named storms (winds of 39 mph or greater), of which 7-11 will become hurricanes (winds of 74 mph or greater), including 3-6 major hurricanes (winds of 111 mph or greater).This update covers the entire six-month hurricane season, which ends November 30, and includes the nine named storms to date. This is the first time NOAA has predicted as many as 25 named storms for a season.
What's driving this active Atlantic hurricane season?
Current oceanic and atmospheric conditions that make an “extremely active†hurricane season possible are warmer-than-average sea surface temperatures in the tropical Atlantic Ocean and Caribbean Sea, reduced vertical wind shear, weaker tropical Atlantic trade winds and an enhanced West African monsoon. These conditions are expected to continue for the next several months.
Another contributing climate factor this year is the possibility of La Niña developing in the months ahead. Indicative of cooler-than-average sea surface temperatures in the equatorial regions of the eastern Pacific Ocean, La Niña can further weaken the wind shear over the Atlantic Basin, which may allow storms to develop and intensify.
nbsp;
How do satellites help forecast and track hurricanes?
Satellites have drastically changed how we forecast and monitor hurricanes. NOAA’s newest fleet of Earth-observing satellites, Geostationary Operational Environmental Satellite – R (GOES-R) Series, and the Joint Polar Satellite System (JPSS), provide remarkable advances in hurricane forecasting as well as new technology to track the storms – their location, movement and intensity.
In 2020, for the first time, GOES-16 (GOES-East) and GOES-17 (GOES-West) wind data are being fed into NOAA’s Hurricane Weather Research and Forecasting (HWRF) computer model used to forecast the track and intensity of tropical cyclones. Also new to the forecast model are data from the COSMIC-2, NOAA-20, and Suomi-NPP satellites. An evaluation of adding these new data sets to the HWRF model showed significant improvements in both track and intensity forecasts.
COSMIC-2 is a constellation of six small satellites that provides information about the distribution of temperature, pressure, and moisture content of the atmosphere. Measuring the moisture in and around tropical cyclones is important because it is a key ingredient for their development and intensification.
The JPSS polar-orbiting satellites (Suomi-NPP and NOAA-20) capture data over each spot on Earth twice a day. They measure the state of the atmosphere by taking precise measurements of sea surface temperatures and atmospheric temperature and moisture, which are critical to securing storm forecasts several days in advance. JPSS instruments provide data that is particularly useful in helping forecasters predict a hurricane’s path 3-7 days ahead of time.
NOAA-20 and Suomi-NPP also carry a microwave instrument that penetrates clouds and allows forecasters a look at the internal structure of tropical cyclones. This helps forecasters understand the intensity of these storms. The Day-Night Band on JPSS satellites allows forecasters to view hurricanes’ cloud structure at night and to monitor power outages for emergency response.
GOES-16 and GOES-17 continuously view the entire Atlantic and eastern/central Pacific hurricane basins to provide real-time tracking and monitoring of tropical cyclones as well as the environmental conditions that cause them to form.
By imaging a storm as often as every 30 seconds, these satellites help forecasters more easily discern the movement of cloud features and provide greater confidence in estimating the center of the storm. The added confidence in locating the center of circulation also helps guide reconnaissance aircraft (“hurricane hunters”) to the correct location.
GOES-16 and GOES- 17 also provide a detailed look at the storm properties of a hurricane, including cloud top cooling, central pressure, and convective structures as well as specific features of a hurricane’s eye, wind estimates, and lightning activity. This information is critical to estimating a storm’s intensity.
Together, these satellites make a powerful team. Each provides critical information for hurricane forecasting, tracking, and intensity estimation. Different vantage points, imaging frequency, and instrumentation provide complementary measurements to help forecasters better understand and predict the behavior of hurricanes, improving public safety and protecting life and property.
As we approach the peak of hurricane season, stay tuned to the National Hurricane Center for the latest information on tropical storm and hurricane activity in the Atlantic.