
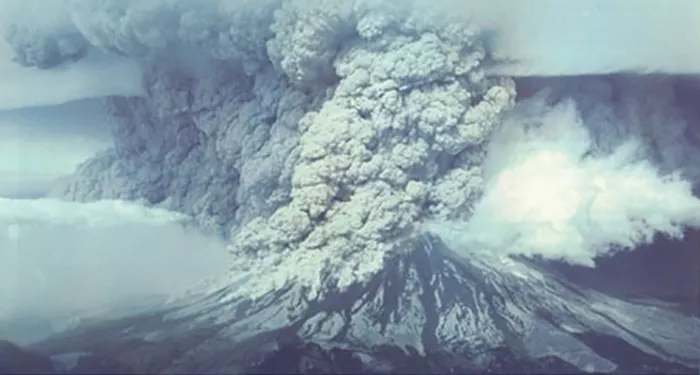
Forty years ago today, iconic Mount St. Helens erupted in southwestern Washington state in the deadliest and most economically destructive volcanic event in U.S. history.
Photograph of Mount St. Helens taken on May 18, 1980, by Joseph Rosenbaum. Courtesy of USGS.
The mountain is one of several active volcanoes in the Cascades range, whose towering conical peak once reached upwards of 9,600 feet. It erupted on May 18, 1980, after lying dormant for more than 123 years.
Leading up to the eruption, a new system of seismographs, which had recently gone into operation at the University of Washington, began recording a series of earthquakes beginning on March 20 that intensified over the next week. By March 27, magma building up beneath the mountain rose up high enough to come into contact with water beneath the surface. Like a pressure cooker, the force of the molten rock and steam started building up under the surface as more frequent earthquakes rocked the area throughout April and into May.
Shortly after 8:30 a.m. PDT on May 18, a huge earthquake caused a mile-wide portion of the mountain’s north face to collapse. The eruption produced a force equal to 10–50 megatons of TNT, the equivalent of 25,000 atomic bombs released over the city of Hiroshima during World War II, and superheated gas and rock exploded out of the volcano sideways at speeds of up to 400 mph. It was followed by a dense plume of thousands of tons of scorching ash that spewed 12 to 16 miles up into the atmosphere, turning the sky dark and the air suffocatingly thick. As 46 billion gallons of slush and water began to race down from the snow-capped mountain, it collected tons of mud, rocks, and trees. This lethal debris slurry, called a lahar, destroyed everything in its path.
Photographers Keith Ronnholm and Gary Rosenquist photographed the event from eleven miles away. The six consecutive images they took over the span of about 40 seconds were stitched together into a time-lapse loop to show what it looked like from the ground.
The eruption continued through late afternoon, and falling ash forced towns and cities up to 300 miles away to call for emergency shutdowns. In all, the event claimed 57 lives, caused more than $1.1B in damages, destroyed more than 200 homes, and released roughly 5.4 million tons of ash that scientists later estimated would stack 150 miles high on a football field. In just three days, the airborne ash had spread across the US and encircled the entire planet in fifteen.
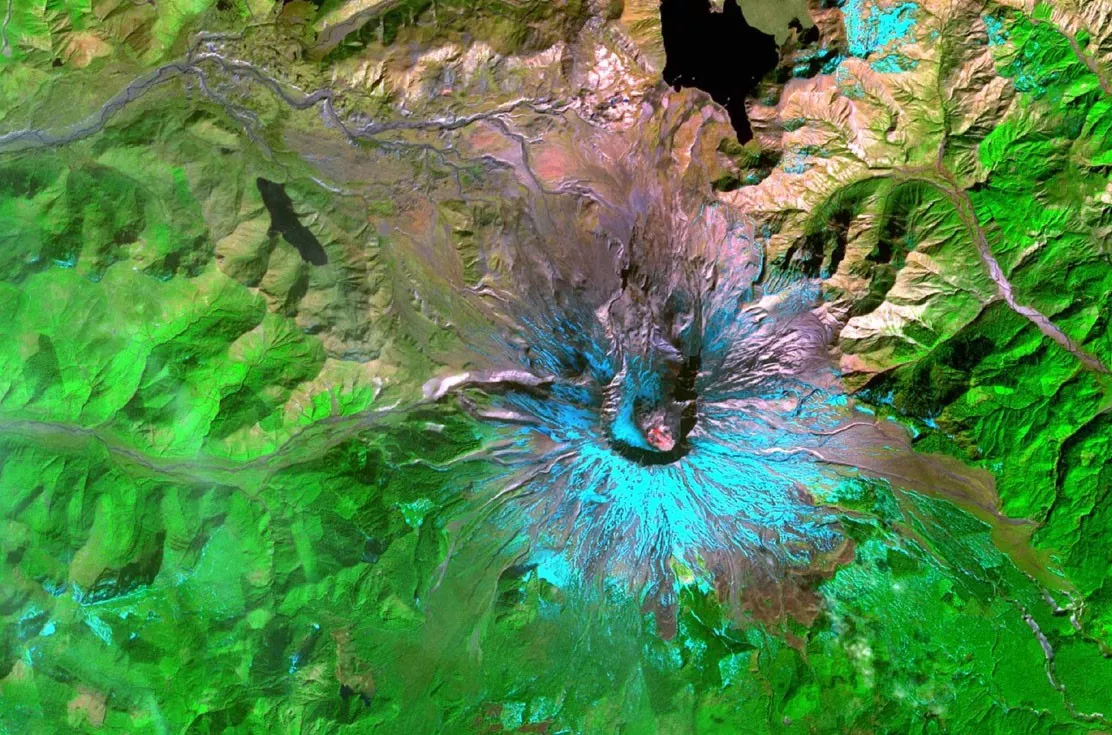
Mount St. Helens as seen from the ASTER instrument onboard NASA’s Terra satellite. Credit: NASA
Satellites Watched the Eruption from Above
Seismographs were not the only thing monitoring the Mount St. Helens eruption. Satellites in orbit collected imagery as well, which helped show the sheer scale of the disaster.
In fact, NOAA's third Geostationary Operational Environmental Satellite (GOES-3) famously captured a plume of ash from the eruption in the images below using its Visible Infrared Spin Scan Radiometer (VISSR) instrument. The information it gathered about the ash cloud helped warn pilots, inform public health officials, and track recovery of the area over time.
“It wasn’t the first eruption to be caught on satellite,” said Tim Schmit, a satellite research meteorologist at NOAA’s Center for Satellite Applications and Research in Madison, Wis., “since polar-orbiters had detected many over the years, and nor was it the first seen from a geostationary satellite.” However, the imagery of Mount St. Helens from GOES-3 was the first of its kind to capture the attention of the world.
Eruption of Mount St. Helens, seen via GOES-3: visible band 1.
Eruption of Mount St. Helens, seen via GOES-3: longwave window infrared band 8.
Better Satellite Technology, Better Volcano Monitoring
As satellite technology continues to improve, we continue to use it to study volcanic eruptions. Mount St. Helens was a very large explosion, but the GOES-3 satellite could only see it via two spectral bands, or wavelengths, as seen above.
The Advanced Baseline Imager (ABI) aboard the current GOES-R series of geostationary satellites, which keep watch over the same areas of Earth over time, utilize 16 bands and can monitor much smaller eruptions in greater detail—pretty good, considering the satellites are more than 22,000 miles up!
Additionally, modern satellites not only monitor volcanic ash , but gases released in volcanic plumes—particularly toxic sulfur dioxide ( SO₂)—which can be visualized through the satellite instrument’s infrared channels. Therefore, it can be seen both during the day and at night. The polar-orbiting Joint Polar Satellite System (JPSS) satellites, along with the GOES ABI sensor, enable more precise observations of SO₂ atop volcanic clouds.
The example below shows four ways that the GOES-16 (GOES-East) satellite viewed the eruption of the Ubinas volcano in Peru on July 19, 2019. On the top left, we see it in GeoColor , which provides color imagery during the day, but also shows clouds at night via its infrared channel. In the upper right, we see the eruption via Ash RGB , which shows ash plumes as reddish-pink in color and SO₂ as bright green. On the lower left, Air Mass RGB , tells us important information about the temperature and moisture characteristics of the plume and ambient air, and on the bottom right, SO2RGB shows where large sulfur dioxide emissions are occurring, and can also be used to detect emissions from industrial facilities.
The eruption of the Ubinas volcano as seen from GOES-16.
Approximately 90 percent of the world's volcanoes are not regularly monitored for activity, but one GOES-R Series satellite makes over 150 billion observations of Earth each day. In order to increase their chances of detecting volcanoes, it is imperative to distill these large volumes of data into helpful information quickly. This need for timely volcanic eruption detection has led to the development of a new automated detection tool called The VOLcanic Cloud Analysis Toolkit (VOLCAT).
This collection of software developed by NOAA, in partnership with the University of Wisconsin‐Madison, generates alerts when volcanic unrest or an eruption is detected, and also automatically tracks and characterizes volcanic clouds. The alerts point to a web‐based report that includes information on cloud growth anomalies, a list of most likely source volcanoes, and relevant satellite imagery. The VOLCAT alerts are currently distributed to expert users at Volcanic Ash Advisory Centers and Volcano Observatories in an experimental manner.
Team Work Makes the Dream Work
None of these advancements would be possible without the amazing people and organizations that collaborate to make the system work. Over the course of satellite development, NOAA has partnered with the United States Geological Survey (USGS), the National Aeronautics and Space Administration (NASA), and other federal agencies to monitor and analyze volcanic eruptions.
The U.S. works with international partners to monitor volcanoes around the world through the Volcanic Ash Advisory Center (or VAACs) network, each with a different area of responsibility. NOAA’s Office of Satellite and Product Operations (OSPO) within the National Environmental Satellite, Data, and Information Service (NESDIS) oversees the VAAC in Washington, D.C., and the National Weather Service is responsible for the Anchorage VAAC. Each VAAC is responsible for the detection, analysis, and forecasting of volcanic ash plumes across their respective areas of responsibility.
Additionally, the Satellite Products and Services Division (SPSD) provides government officials and the public with visualizations of current and past eruptions, along with advisories in relation to any recent volcanic activity. The aviation industry, which has been crippled by large eruptions in the past, also helps push research and developments about eruptions and related phenomena forward through USGS, NOAA, the Federal Aviation Administration (FAA), and the International Civil Aviation Organization (ICAO).
Check Out More From Orbit
As part of this 40th anniversary feature, we also wanted to highlight some of the most compelling volcano imagery we’ve collected from the last four decades. Below are some of our favorite satellite views of other volcanoes around the world, which demonstrate their awesome power—and sobering destruction—as seen from Earth orbit.
The eruption of Mount Pinatubo in the Philippines occurred on June 15, 1991 right as Typhoon Yunya (known in the Philippines as Typhoon Diding) struck the region. This imagery, captured by Japan’s Geostationary Meteorological Satellite-4 (GMS-4, AKA: Himawari-4), shows both the swirling storm and the eruption (by the black arrow) via infrared band 8. Image generated by UW/CIMSS.
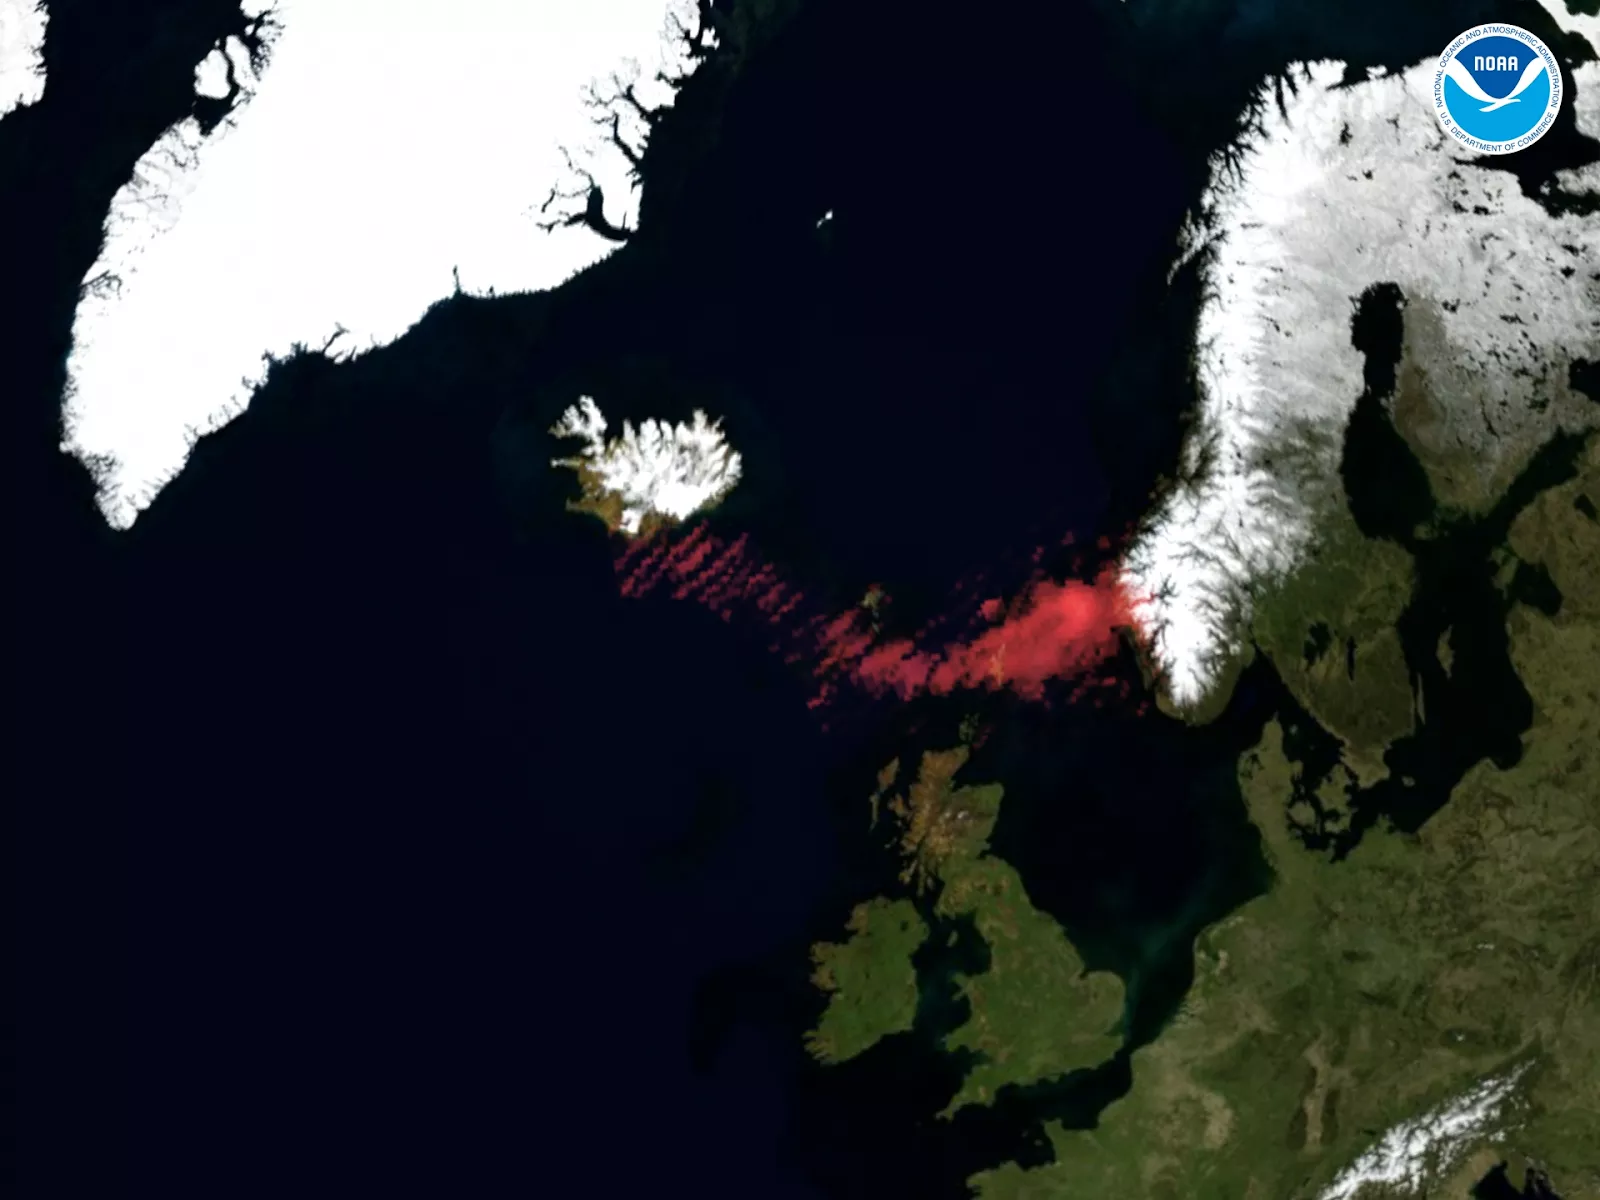
With its Ozone Monitoring Instrument (OMI), NASA’s Aura satellite captured the SO₂ plume from Iceland’s Eyjafjallajokull eruption on April 15, 2010, as seen here from NOAA’s Automated OMI SO₂ Alert System.
GOES-16 (GOES-East) captured the eruption of the Sierra Negra volcano in the Galápagos Islands on July 1, 2018, shown in this multispectral red-green-blue (RGB) imagery. This volcanic plume was rich in sulfur dioxide ( SO₂), depicted as a green plume in this imagery. SO₂ detection is a new capability offered by the GOES-R Series Advanced Baseline Imager. Imagers on the earlier GOES are able to detect an ash cloud, but not the SO₂ signature.
This imagery may look like modern art, but it’s actually a view captured by the GOES-16 (GOES-East) satellite of the Popocatépetl volcano in Mexico, which erupted on Sept. 27, 2017. The reddish-pink coloration toward the center of the frame indicates the ash plume. The other colors denote the following: yellowish/brown colors are thick clouds, the dark blues are thin cirrus clouds, and the pale blue indicates the surface (land and water) of the Earth. This RGB product is via the European Organisation for the Exploitation of Meteorological Satellites (EUMETSAT).
The eruption of Guatemala’s Volcán de Fuego on Feb. 1, 2018 was captured by GOES-16 (GOES-East). Displayed here are four of the many ways the satellite viewed the event. On the upper left, GeoColor provides a near True Color view. On the upper right, we can see the eruption via “Red visible” band 2, which has the finest spatial resolution of all ABI bands. On the lower left, we can see Ash RGB ; and on the lower right, Fire Temperature RGB , which shows where the most intense heat signatures and fires are located.
GOES-16 later caught the same volcano (Volcán de Fuego) erupting again on June 3, 2018. In the GeoColor imagery below, we can see brownish ash rip through the clouds overhead.
On Nov. 21, 2018, the GOES-17 satellite spotted the eruption of Mount Veniaminof on the Alaskan Peninsula. The dark plume, which reached up to 13,000 feet high and extended more than 250 miles over the water, can be clearly seen via this SO₂ RGB imagery.
Skies were clear over the Andes mountains in southern Peru on May 29, 2019, when the Sabancaya volcano erupted. The GOES-16 satellite captured this GeoColor imagery of the ash plume.
On June 22, 2019, Japan’s Himawari-8 satellite captured this spectacular imagery of the Raikoke volcano as it erupted on the Kuril Island chain of Russia’s Kamchatka Peninsula.
Here’s the same eruption of the Raikoke volcano seen by GOES-17 (GOES-West). This SO₂ RGB imagery shows the plume in the lower left-hand corner of the frame.
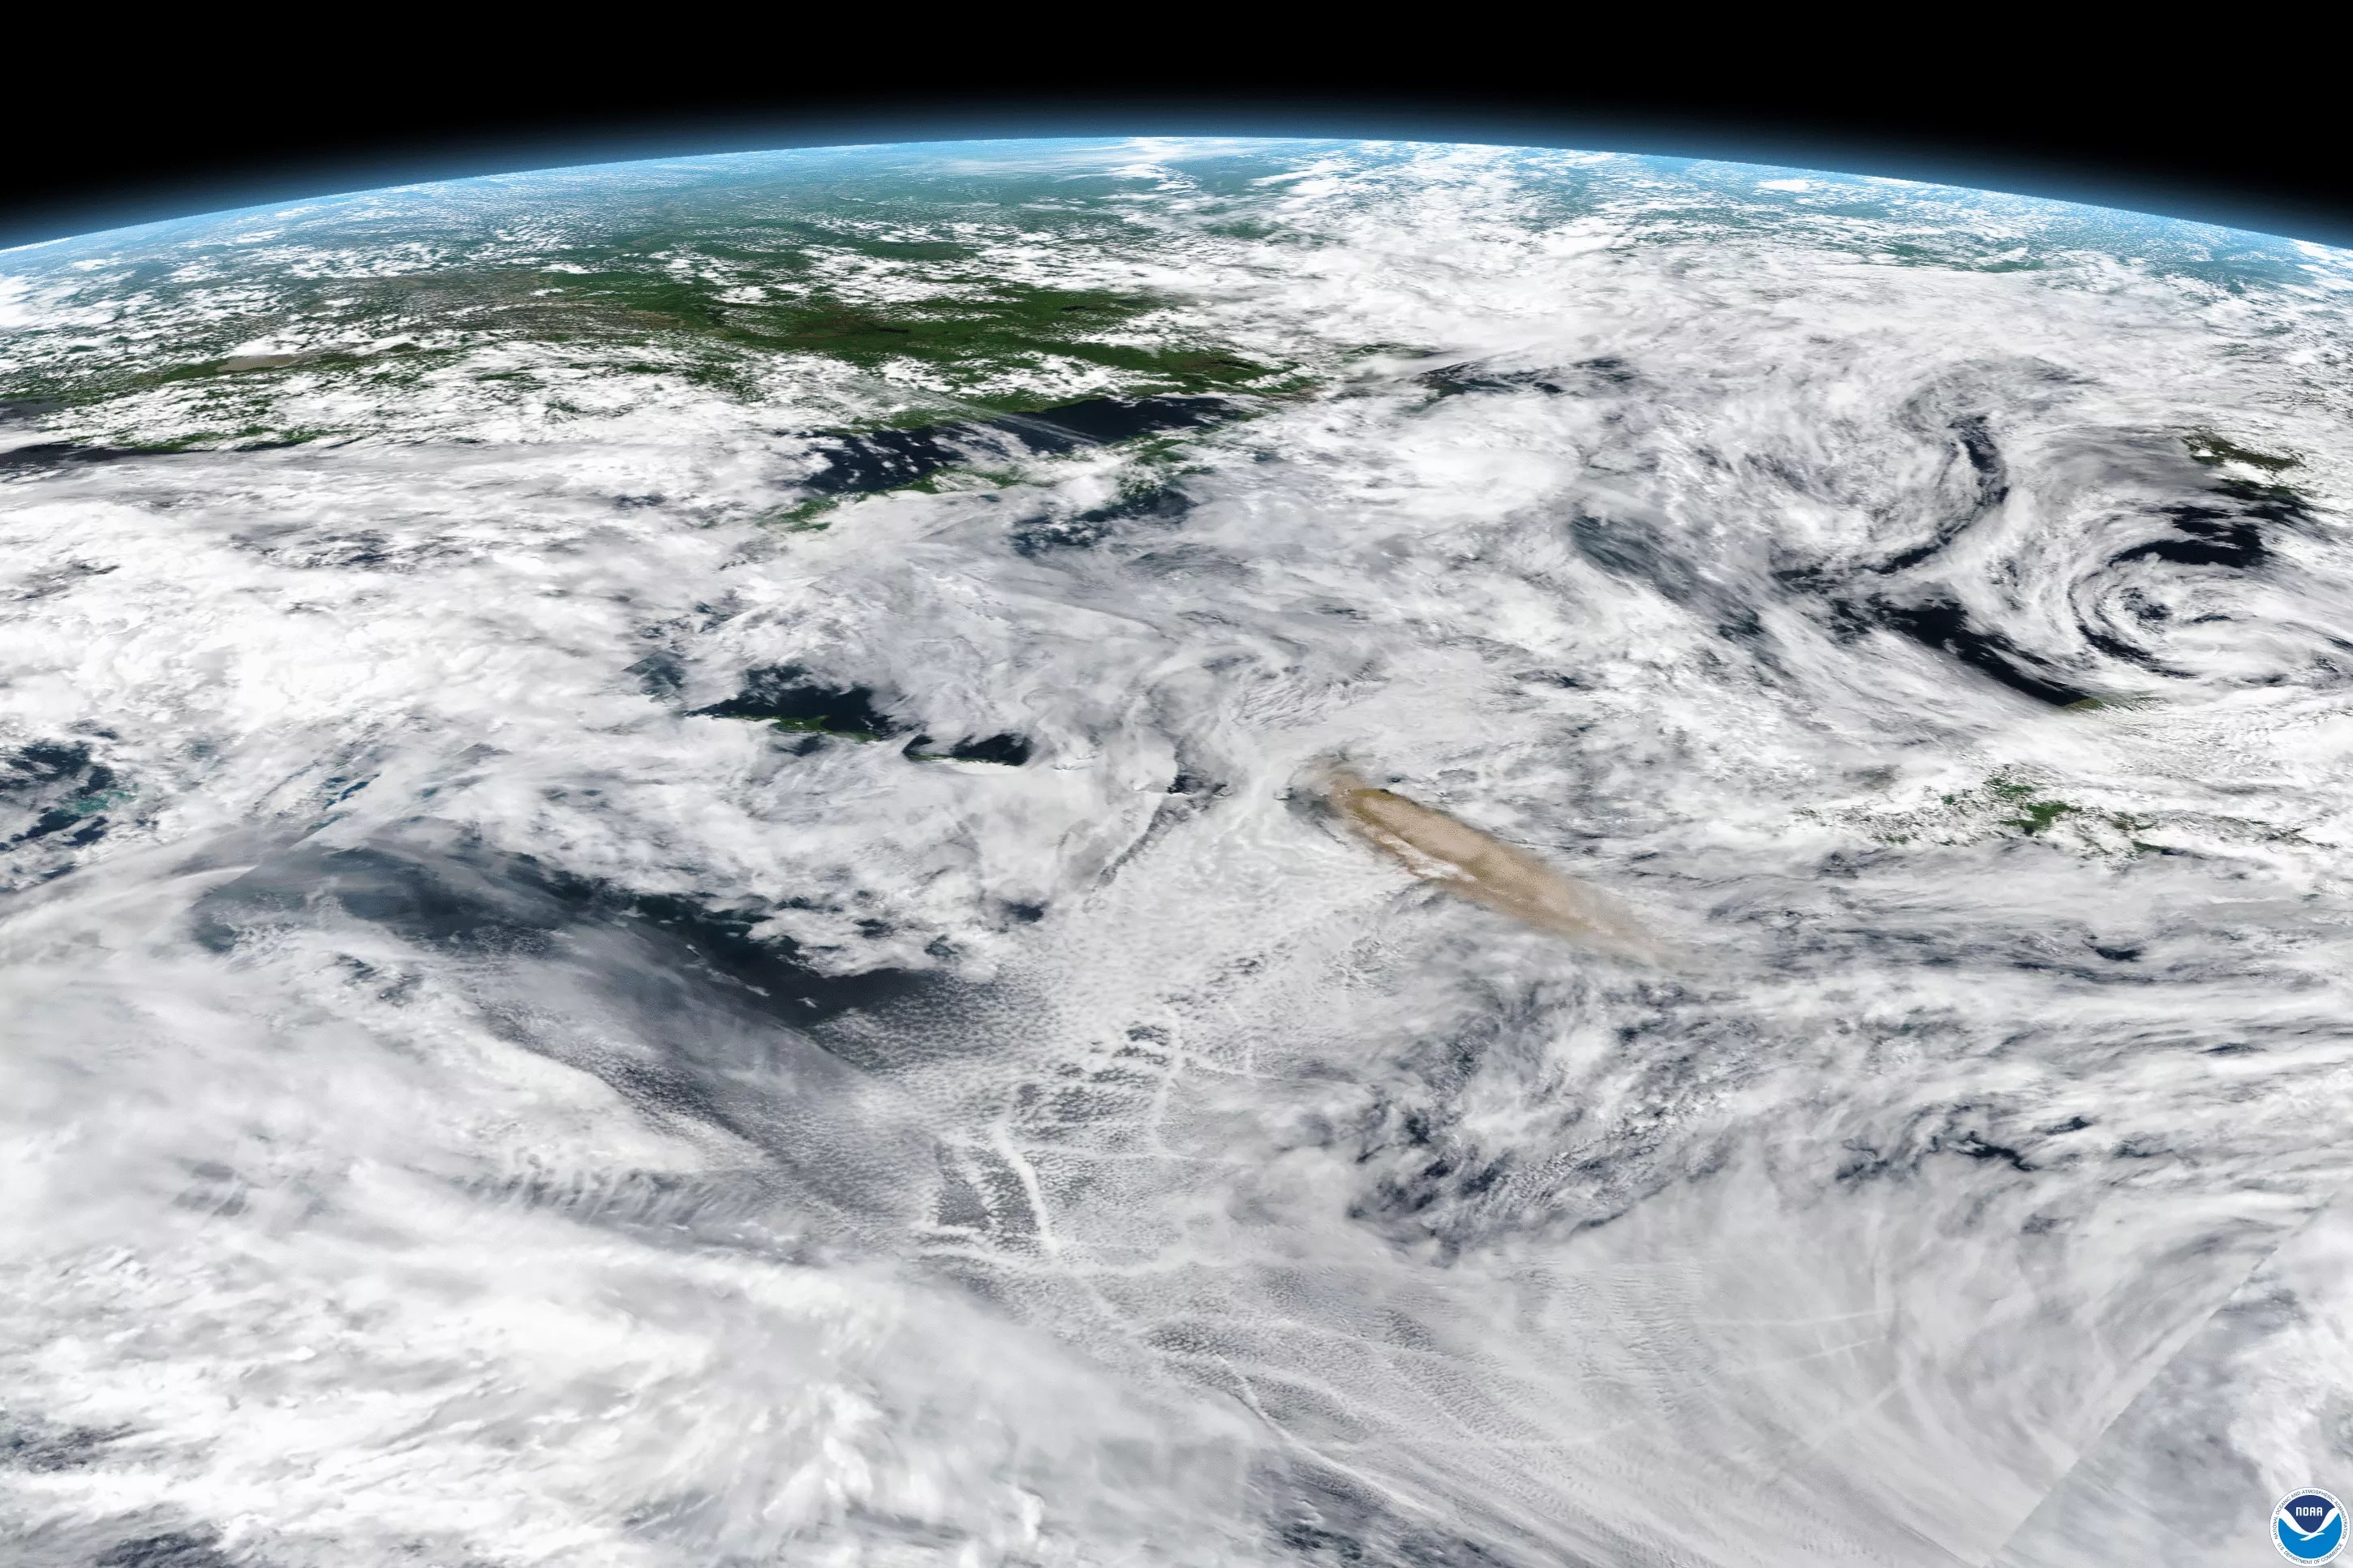
The Raikoke volcano’s eruption was also seen by the NOAA/NASA polar-orbiting satellite, Suomi-NPP, which captured this still image as it zoomed over the area.
The recent eruption of the Taal volcano, located on Luzon island in the Philippines, was seen by the Himawari-8 satellite on January 12, 2020. Here, we can see the scope of the blast via the sensor’s infrared band 13.
To See More From Space:
On Twitter
GOES ABI imagery: