
With a little more than a month left in the official Atlantic Hurricane Season , NOAA’s Satellite and Information Service reminds you not to let your guard down. Despite being toward the end of the season’s peak window, late October has occasionally produced devastating hurricanes that have hit the United States and elsewhere.
In a typical Atlantic hurricane season, there are an average of 14 named storms, about three of which form in October. In 2024, extremely dangerous Hurricane Milton became the most intense hurricane of the 2024 Hurricane Season so far, with sustained winds of around 180 mph on Oct. 7. Milton made landfall near Siesta Key, Fla., as a major Category 3 hurricane on Oct. 9.
Other recent memorable October hurricanes include 2020’s Hurricanes Delta and Zeta, which both struck Louisiana, 2018's Hurricane Michael, which devastated the Florida Panhandle, and 2016's Hurricane Matthew that lashed eastern North Carolina.
But even late-October hurricanes can unleash a mighty fury; and when they do, NOAA satellites are continuously monitoring their track and strength. Below is a look at three late-October hurricane standouts from NOAA's perspective in Earth orbit.
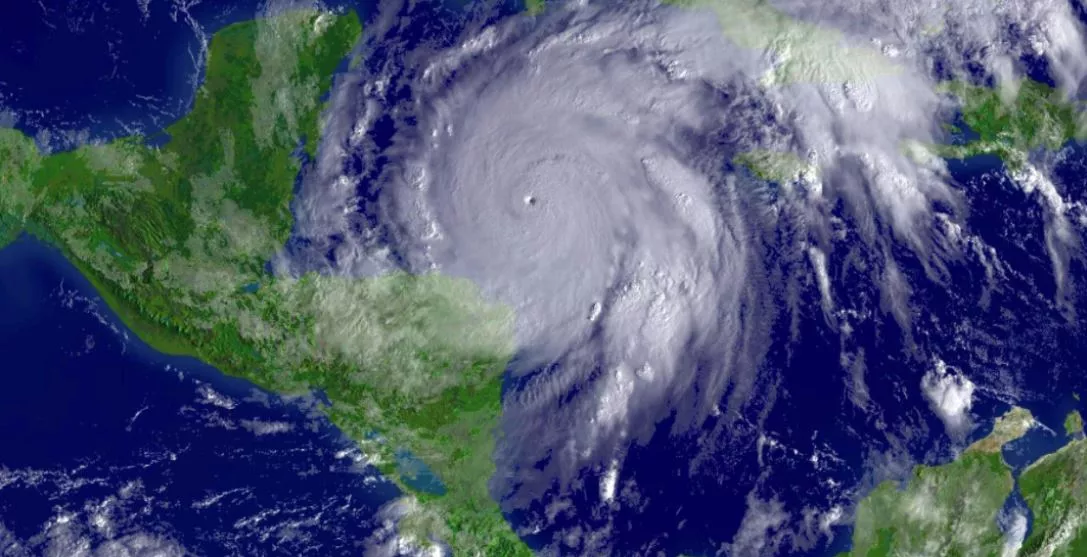
Visible satellite animation of Hurricane Mitch from GOES-8, Oct. 26, 1998.
Hurricane Mitch (1998)
Hurricane Mitch was one of the deadliest Atlantic tropical cyclones in history, ranking only below the 1780 “Great Hurricane” in the Lesser Antilles, and comparable to the Galveston, Texas, hurricane of 1900. Mitch was responsible for more than 9,000 deaths and 9,000 missing, predominantly from massive rain-induced flooding in portions of Central America.
Mitch began as a tropical storm over the southwestern Caribbean Sea on October 22, 1998 and strengthened to a hurricane by the 24th. Mitch then rapidly strengthened, becoming a monster Category 5 hurricane with a central pressure of 905 mb on the 26th—ranking it in the Top 10 most intense Atlantic hurricanes on record.
Mitch made landfall in Honduras as a much weaker Category-1 hurricane, but it ravaged the offshore islands with high winds, seas, and storm surge. However the greatest impact was widespread heavy rains and severe floods in Honduras, Nicaragua, Guatemala, and El Salvador that left thousands dead or missing and caused tremendous property, infrastructure, and crop damage in Central America.
After making landfall, Mitch eventually moved back into the Gulf of Mexico and headed toward Florida, making another landfall as a tropical storm. Two people died in the Florida Keys when a fishing boat capsized and Mitch caused an additional $40 million in damage in Florida.
Infrared satellite of image of Hurricane Mitch from GOES-8, Oct. 26, 1998.

Multispectral false-color satellite image of Hurricane Mitch from NOAA-14, Oct. 26, 1998.
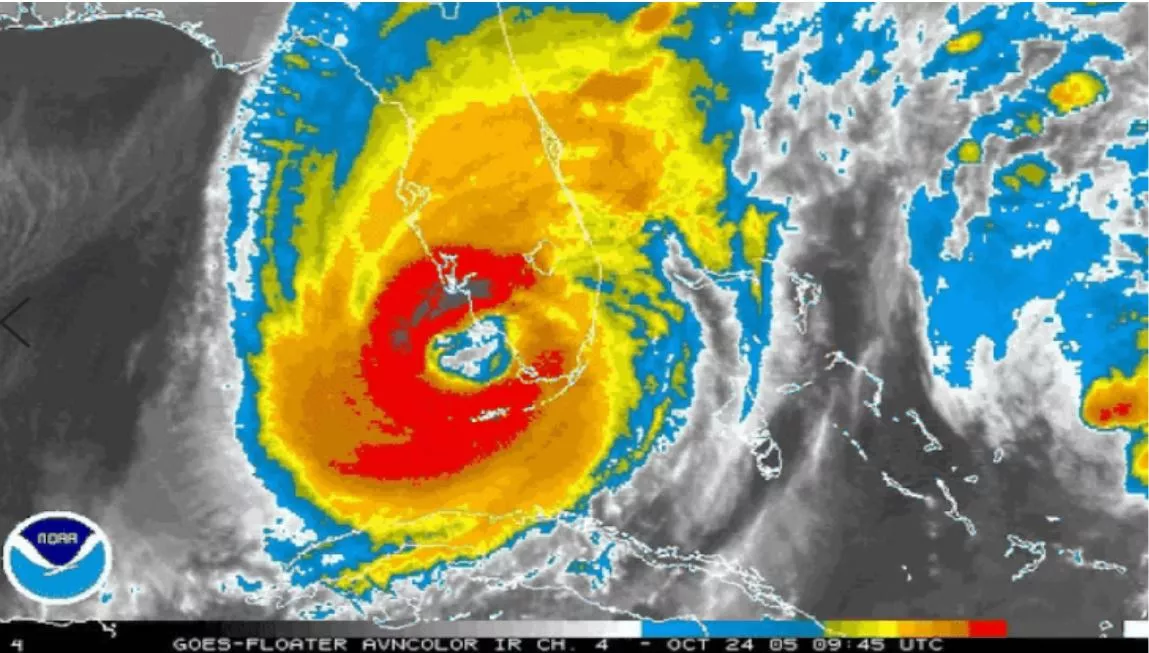
Infrared satellite animation of Hurricane Wilma from GOES-12, Oct. 24, 2005.
Hurricane Wilma (2005)
The last named storm of the historic 2005 season before switching to the Greek alphabet, Wilma still stands as the most intense hurricane ever recorded in the Atlantic Basin.
Wilma was given its name on October 17, when a tropical depression in the Caribbean grew into Tropical Storm Wilma. From there, explosive intensification took place on the 18th with Wilma transforming from a 70-mph tropical storm to a 170-mph Category-5 hurricane in less than 24 hours. Its barometric pressure bottomed out at 882 mb, a record for the Atlantic.
Wilma made landfall on the island of Cozumel, Mexico, on October 21 as a Category-4 Hurricane. After devastating the Yucatan Peninsula, Wilma made a U-turn and moved across the extreme southeastern Gulf of Mexico. It made landfall again in southern Florida during the morning hours of October 24th, bringing hurricane-force winds to the Florida Keys along with the highest storm surge observed in the Keys since Hurricane Betsy in 1965. It’s estimated that Wilma produced more than $20 billion in damage as it crossed the state of Florida and headed out into the Atlantic.
Satellite image of Hurricane Wilma from GOES-12, Oct. 19, 2005.
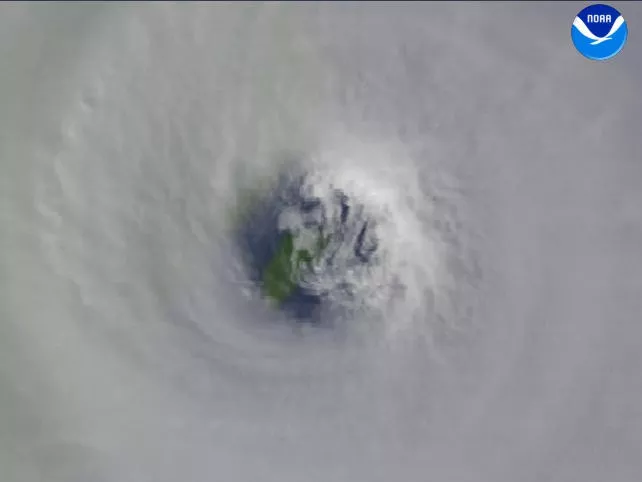
GOES-12 satellite image of Hurricane Wilma as its eye passed over Cozumel, Oct. 21, 2005.
Hurricane Sandy (2012)
Sandy started out as a classic late-season tropical system in the southwestern Caribbean Sea. It first made landfall in Jamaica on October 24 as a Category-1 hurricane, then continued to move northeastward as a Category-3 hurricane before making landfall again in eastern Cuba.
After moving over the Bahamas, Sandy underwent a complex evolution and grew considerably in size despite weakening into a tropical storm north of the islands. The system restrengthened into a hurricane while it moved northeastward, parallel to the coast of the southeastern United States, eventually turning northwestward toward the mid-Atlantic states.
As it moved toward the U.S., Sandy weakened slightly and made landfall on October 29 as a post-tropical cyclone near Brigantine, New Jersey, with sustained winds of around 80 mph. Because of its tremendous size, however, Sandy drove a catastrophic storm surge into the New Jersey and New York coastlines. Both Staten Island and Manhattan recorded flooding of four-to-nine feet above ground level; In New Jersey, Monmouth and Middlesex counties also had similar inundations.
Sandy’s storm surge, in addition to large and battering waves, devastated large portions of the coasts of New Jersey and New York. It’s estimated that Sandy caused $65 billion in damage across the East Coast before weakening into a remnant low over the Northeastern U.S.

Infrared satellite image of Hurricane Sandy from Suomi-NPP, Oct. 25, 2012.