
Farmers and ranchers rely on the land to make a living, and while there are many ways to prepare for natural disasters, a newly-defined type of drought can certainly throw a wrench in their best-laid plans.
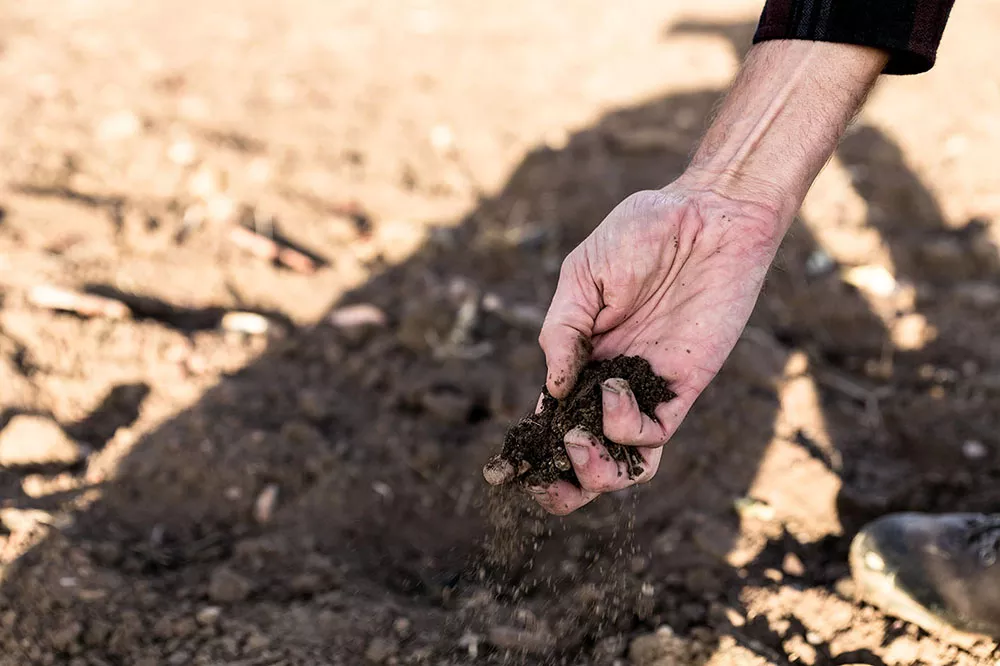
Photo by Jasper Wilde on Unsplash
Imagine you’re a rancher, and on June 1 your pasture is looking great, your cows are fat and happy, and there’s no sign of trouble on the horizon. If you fast forward several weeks, you could be in the midst of what’s called a flash drought and grappling with having to sell some of your livestock because your once-green pastures are no longer producing enough forage. Not only could you be faced with having to sell some of your livestock, but you could also encounter a saturated market and depressed prices because other producers are also selling parts of their herds. This means that you probably aren’t going to get as much money for those fat, once-happy cows either.
This is a very plausible scenario that Jason Otkin, a researcher with the University of Wisconsin-Madison Cooperative Institute for Meteorological Satellite Studies (CIMSS), began studying in 2012 when a devastating flash drought developed across much of the central U.S.
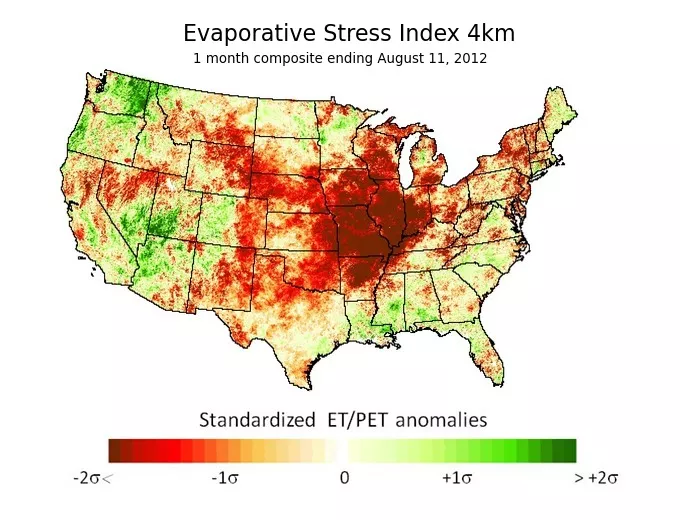
Here you can see the Evaporative Stress Index (ESI) depiction of the 2012 flash drought event across the Midwestern U.S. Red and brown colors indicate extreme moisture stress. (USDA)
Traditionally droughts are defined as natural disasters that occur over an extended period of time. While it can sometimes take many months or years for a drought to reach full intensity, Otkin explained that flash droughts can take people by surprise because of their rapid development.
Based on research performed by Otkin and others in the drought community, the American Meteorological Society recently defined a flash drought as “an unusually rapid onset drought event characterized by a multi-week period of accelerated intensification that culminated in impacts to one or more sectors (agricultural, hydrological, etc.)."
Otkin, in collaboration with Martha Anderson at the U.S. Department of Agriculture, is using satellite data and imagery to alert farmers and ranchers about impending flash droughts. They use a tool called the Evaporative Stress Index (ESI), which was developed by Anderson and Chris Hain, a NASA SPoRT research scientist.
Thermal infrared imagery from both the GOES-R series satellites, as well as polar orbiting satellites like NOAA-20 and Suomi-NPP, is used to estimate evapotranspiration, which is a measure of how much water is being transferred from the land to the atmosphere through the soil and plants. In order to calculate the ESI, that estimate is then compared to a potential evapotranspiration estimate, as well as climatology at that location to determine if the area is experiencing a moisture deficit or a moisture surplus.
Otkin said he looks at how quickly ESI changes from week to week to determine whether a flash drought is developing.
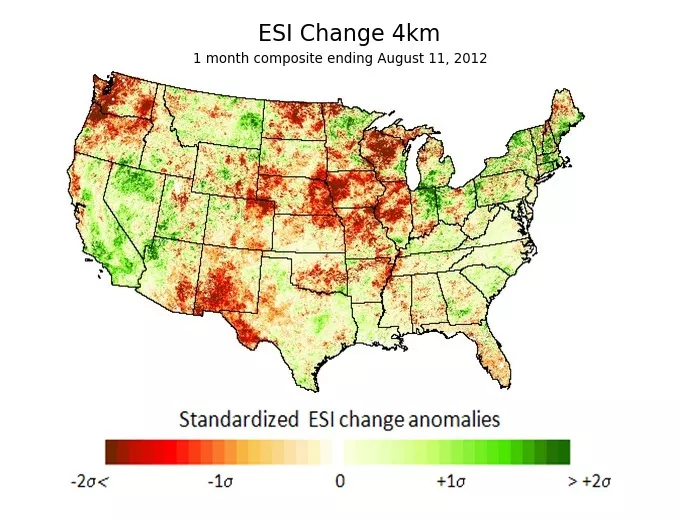
This image shows how the 1-month ESI changed over a 1-week period. These are "standardized" changes rather than actual raw changes in the ESI, and that allows you to more cleanly assess how unusual the changes are with respect to the local climatology. The red and brown colors across the Midwest show that conditions were deteriorating very rapidly compared to climatology. (Jason Otkin/CIMSS)
“If it's (the ESI) decreasing rapidly, then that points toward the development of a flash drought,” he added. “A moisture deficit though is also required at some point in order for it to actually be considered a drought.”
Although drought researchers are still trying to define the exact thresholds to characterize a flash drought, Otkin explained that one requirement is that it “must actually fall into drought either during or by the end of the rapid intensification period to be considered a drought.”
As part of his research, Otkin and collaborators from the University of Nebraska-Lincoln and the USDA Midwest Climate Hub conducted a series of focus groups with farmers and ranchers across the Midwest that were designed to both provide a better understanding of how flash droughts impact different parts of the agricultural sector and verify the accuracy of ESI maps from previous drought events.
By talking to farmers and ranchers, Otkin got a better understanding of how they made decisions during previous droughts, what information would have helped them make those decisions, and what kind of impact those decisions had on current and future growing seasons.
The overarching goal, he explained, is to find the best way to deliver flash drought warnings to those in the agricultural sector so they are prepared.
“There are a lot of farmers and ranchers that are very interested in learning about new tools because they want to try to be able to apply these new tools to improve their decision-making process,” Otkin said.
These focus group meetings allowed Otkin to present new tools that could be useful for either monitoring current conditions or trying to predict future changes in drought conditions to farmers and ranchers. They also gave him the opportunity to receive valuable feedback from those in the agricultural sector.
“It’s important to be able to put these datasets into the most optimal format,” Otkin explained. “That could be simple things such as changing the color table, for example.”
While it may seem trivial, Otkin said something as simple as understanding how farmers and ranchers want to receive updates and what format those updates are in is very important.
Using the ESI tool, it’s now possible to deliver a probabilistic forecast, like the ones we get from the National Weather Service, a month or so ahead of the onset of a flash drought. That is great news for the agricultural sector because from 2012 to 2018, drought cost the U.S. an average of $9 billion per event, third to tropical cyclones and wildfires which cost an average of $50.7 billion and $10 billion per event respectively, according to NOAA’s National Centers for Environmental Information (NCEI).
Otkin said his hope is that new tools and better forecasts give the agricultural sector even more options to deal with drought and can help mitigate their future impact.