
JPSS-2 (Now called NOAA-21)
JPSS-2 successfully lifted off from Vandenberg Space Force Base on Nov. 10, 2022 at 1:49 a.m. PST.

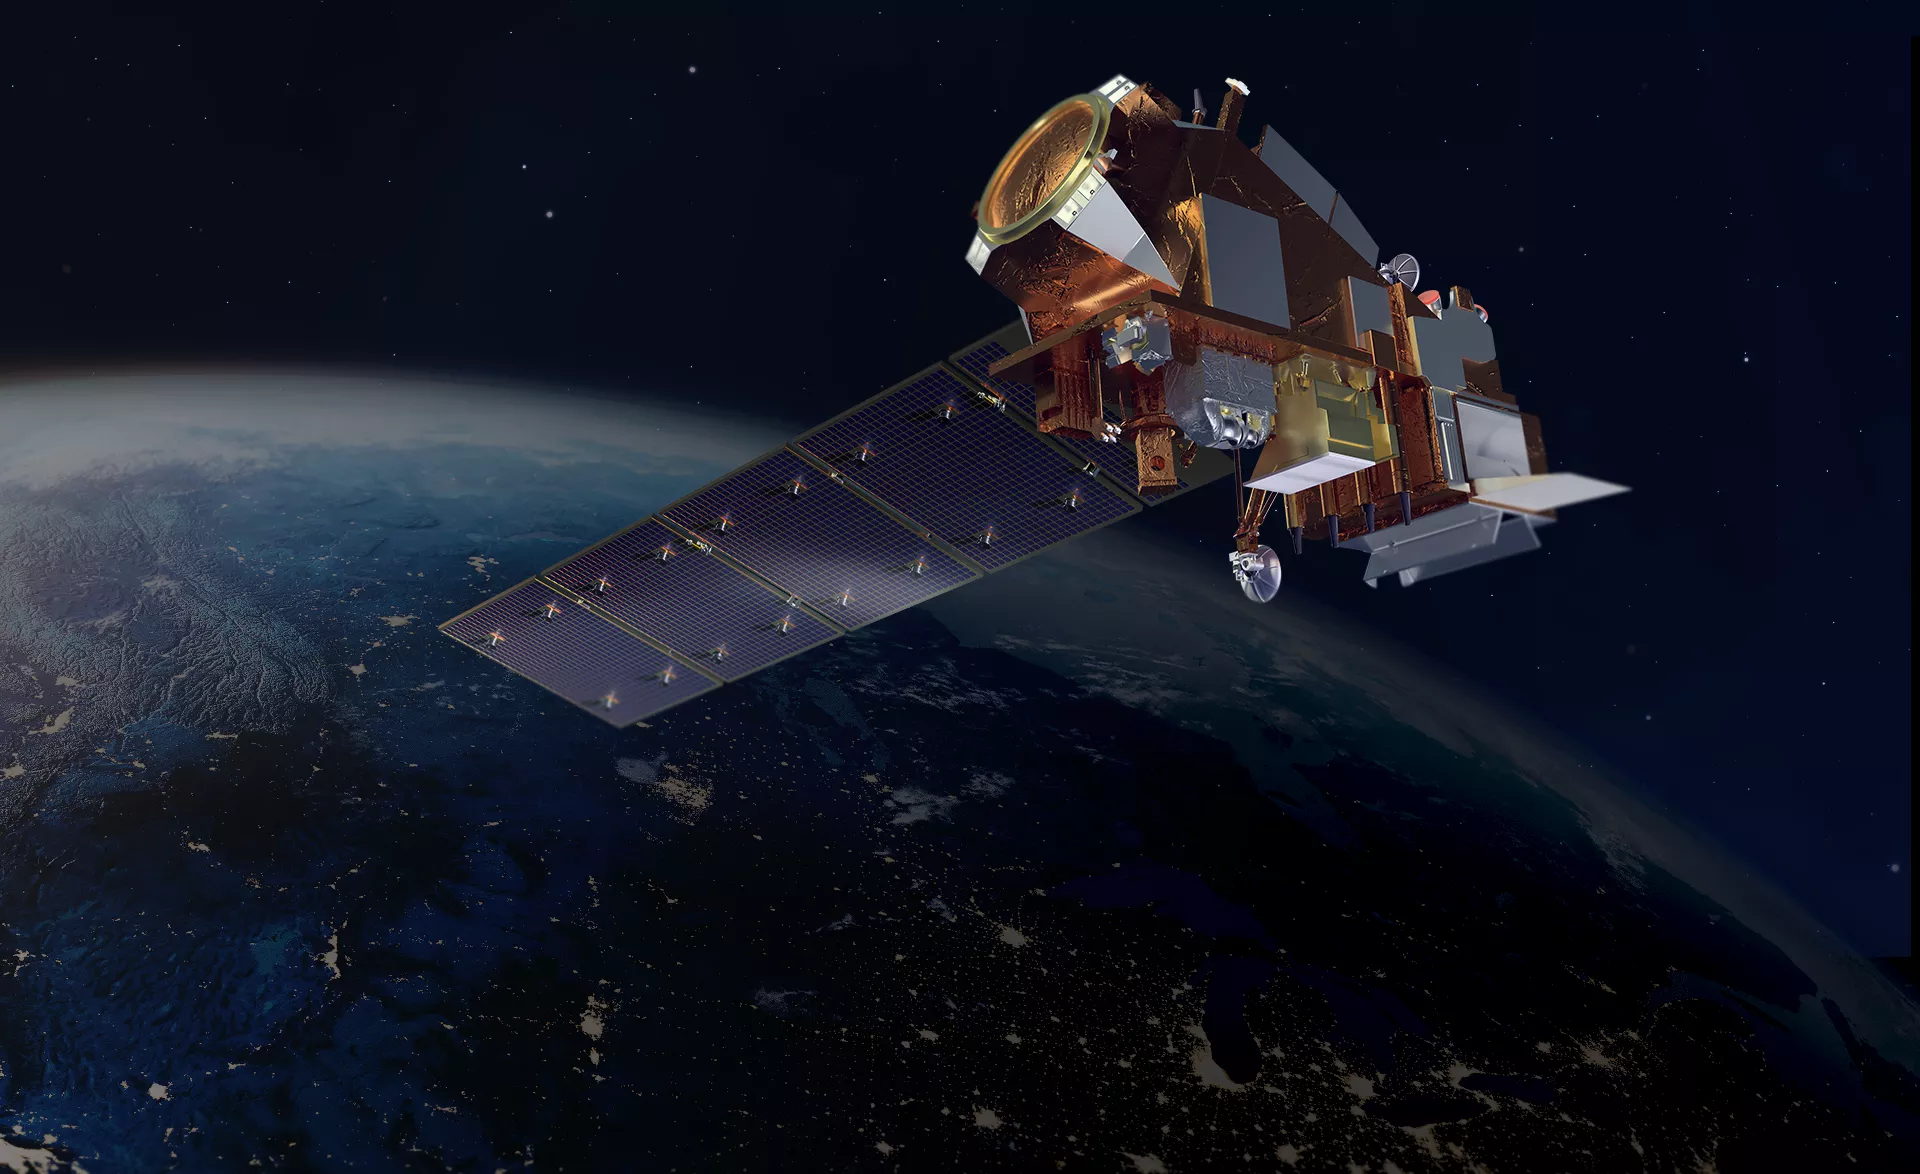
Inside the JPSS-2 Satellite
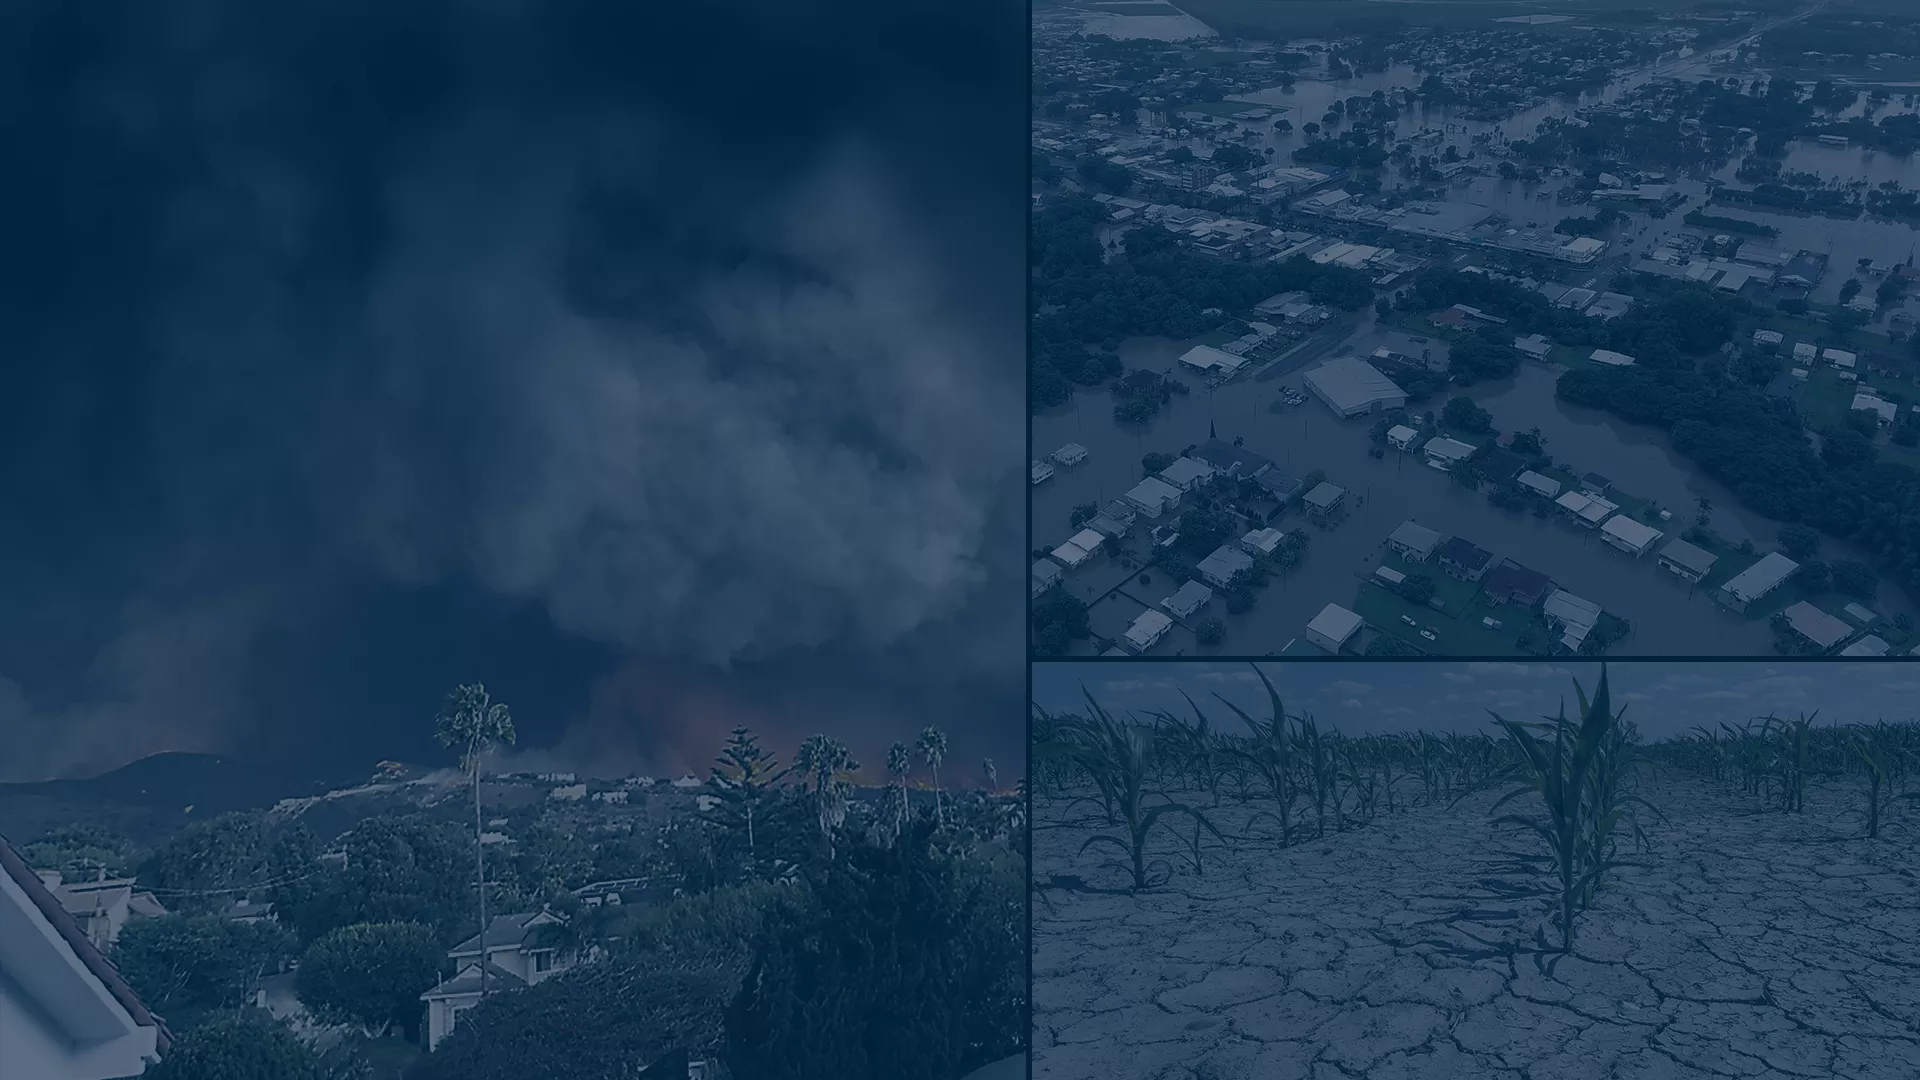
A record number of Americans experienced extreme weather firsthand in the last decade. Some woke to floodwater outside their homes or wildfire smoke in their sky.
Others suffered sweltering heat waves that didn't let up and parched soil on their farms.
NOAA’s Joint Polar Satellite System (JPSS) supports essential forecasts for these extreme weather events, feeds daily weather models, and monitors climate change.
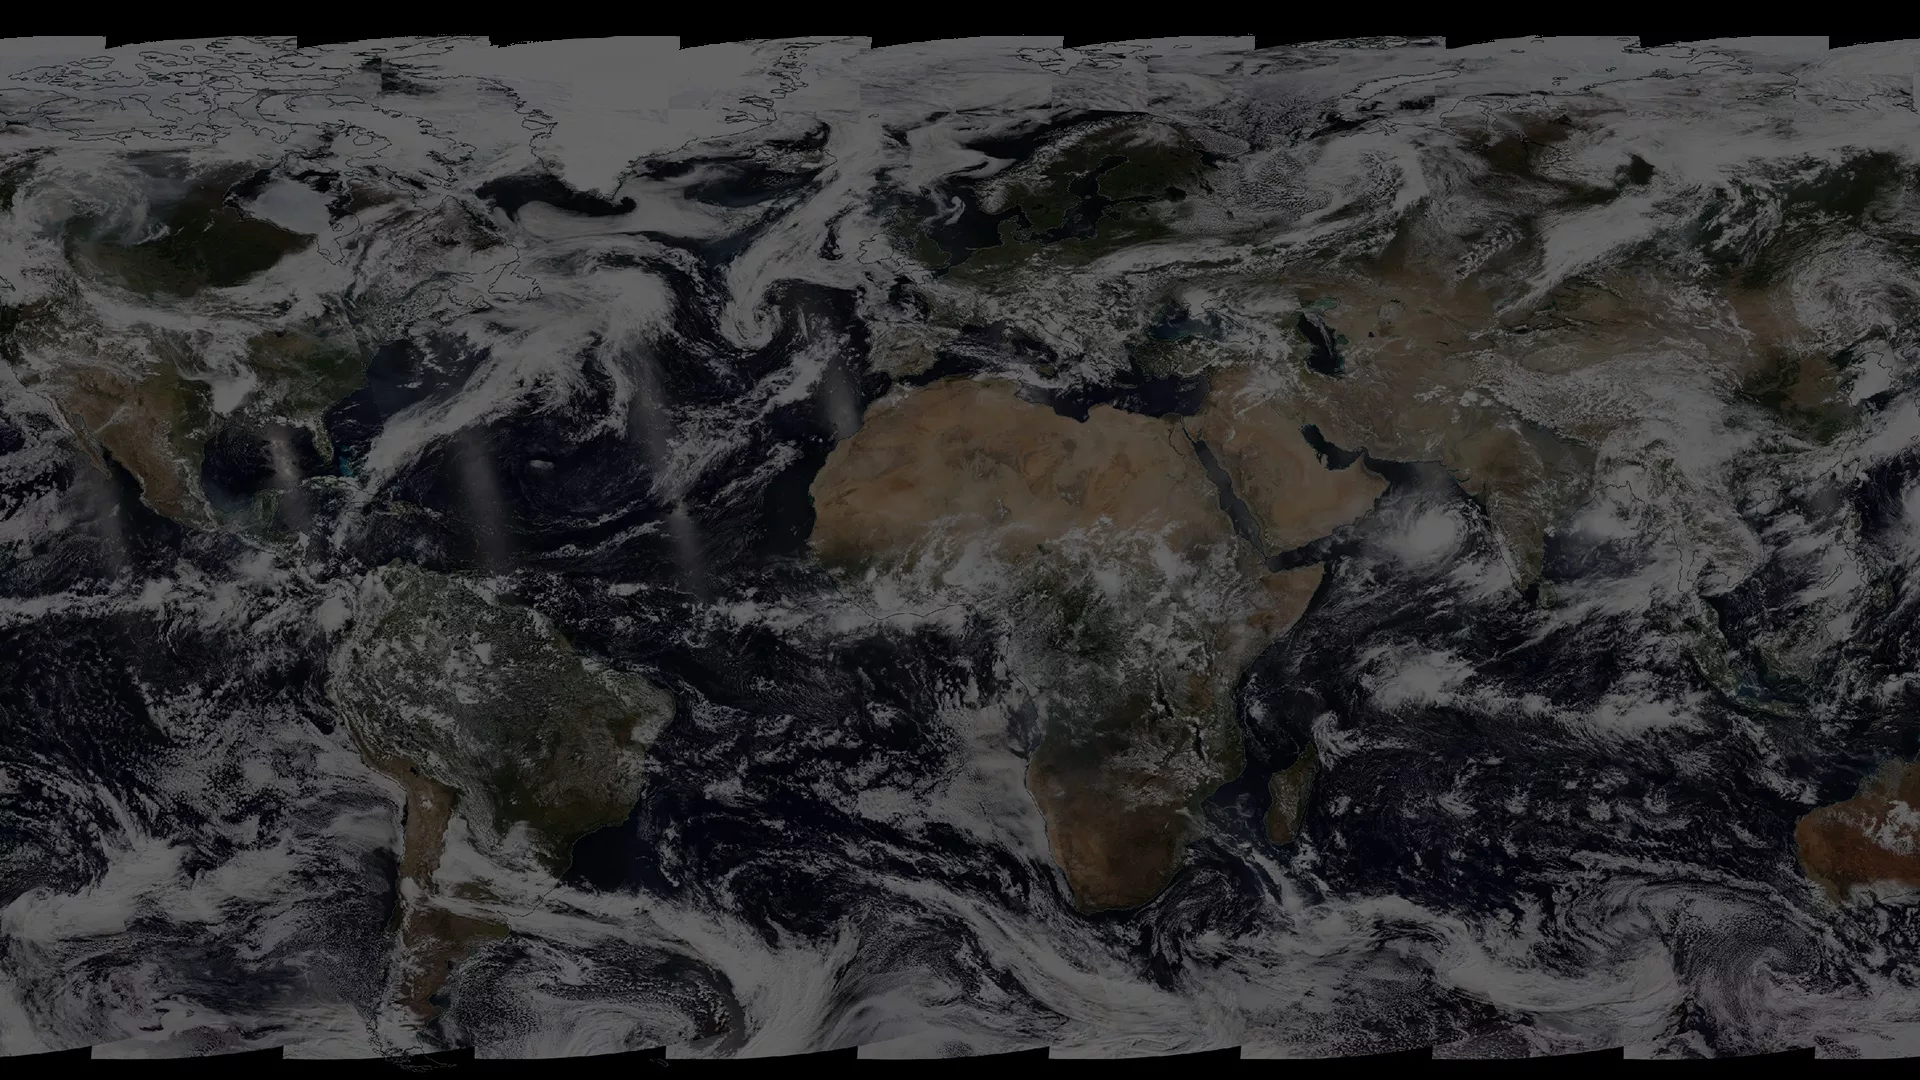
For more than a decade, the JPSS satellites, a partnership between NOAA and NASA, have each orbited the Earth from the North to the South Pole 14 times a day, flying over every spot on the planet at least twice. As these satellites race around Earth, they take measurements and snap images that help us plan for hurricanes, snowstorms and floods. They map and monitor wildfires and volcanoes.
For more than a decade, the JPSS satellites, a partnership between NOAA and NASA, have each orbited the Earth from the North to the South Pole 14 times a day, flying over every spot on the planet at least twice. As these satellites race around Earth, they take measurements and snap images that help us plan for hurricanes, snowstorms and floods. They map and monitor wildfires and volcanoes.
They closely watch our oceans, spotting harmful algal blooms and measuring sea surface temperatures and sea ice. They provide critical data to global weather models. They tell us about the things that fill up our air and our lungs, like dust, smoke, and smog.
They closely watch our oceans, spotting harmful algal blooms and measuring sea surface temperatures and sea ice. They provide critical data to global weather models. They tell us about the things that fill up our air and our lungs, like dust, smoke, and smog.
Your Weather Forecast
Any time you look up the weather on your smartphone or watch a local weather forecast, you’re using JPSS data.
The JPSS satellites feed critical data to global weather models. The measurements they collect on atmospheric temperature and moisture, clouds, aerosols, and sea surface temperatures, all contribute to weather forecasting. These data provide the atmospheric conditions needed to generate forecasts three to seven days in advance.
Climate Change
JPSS satellites also take the temperature of our lower and upper atmosphere. By contributing to a long-term archive of these temperature measurements, they show us how our planet’s atmosphere has changed over time.
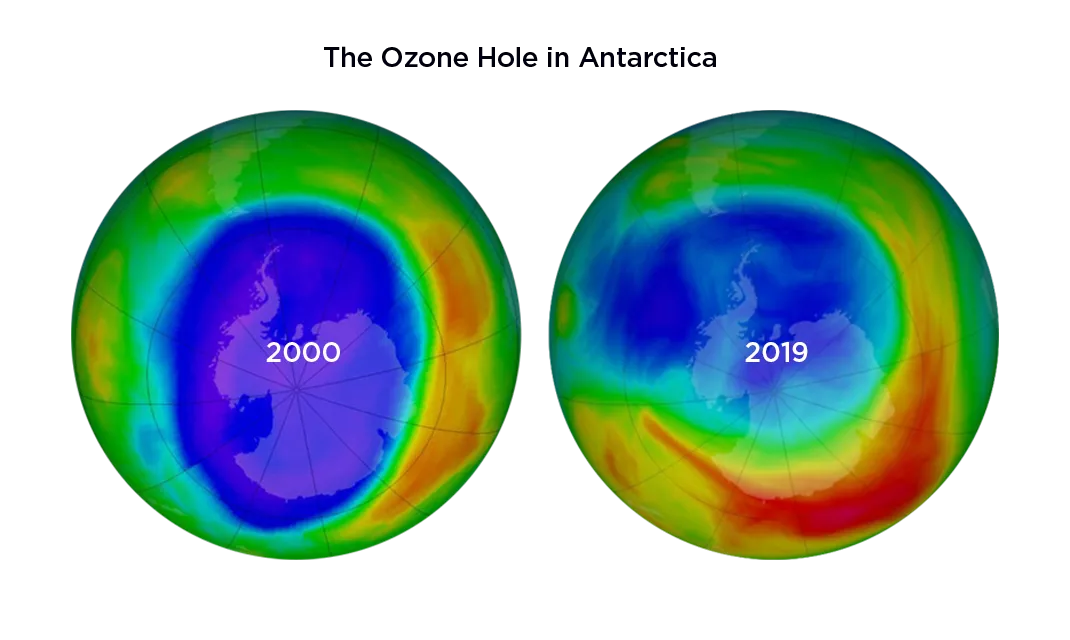
And they collect data on ozone that continues five decades of records. These measurements are used by ozone-assessment researchers and policy makers to create global climate models and monitor global ozone concentrations.
Climate Change
JPSS satellites also take the temperature of our lower and upper atmosphere. By contributing to a long-term archive of these temperature measurements, they show us how our planet’s atmosphere has changed over time.
And they collect data on ozone that continues five decades of records. These measurements are used by ozone-assessment researchers and policy makers to create global climate models and monitor global ozone concentrations.

Helps Us Understand Extreme Weather
Click on the red dots in this spinning planet to see the role the JPSS satellites have played in major weather events:
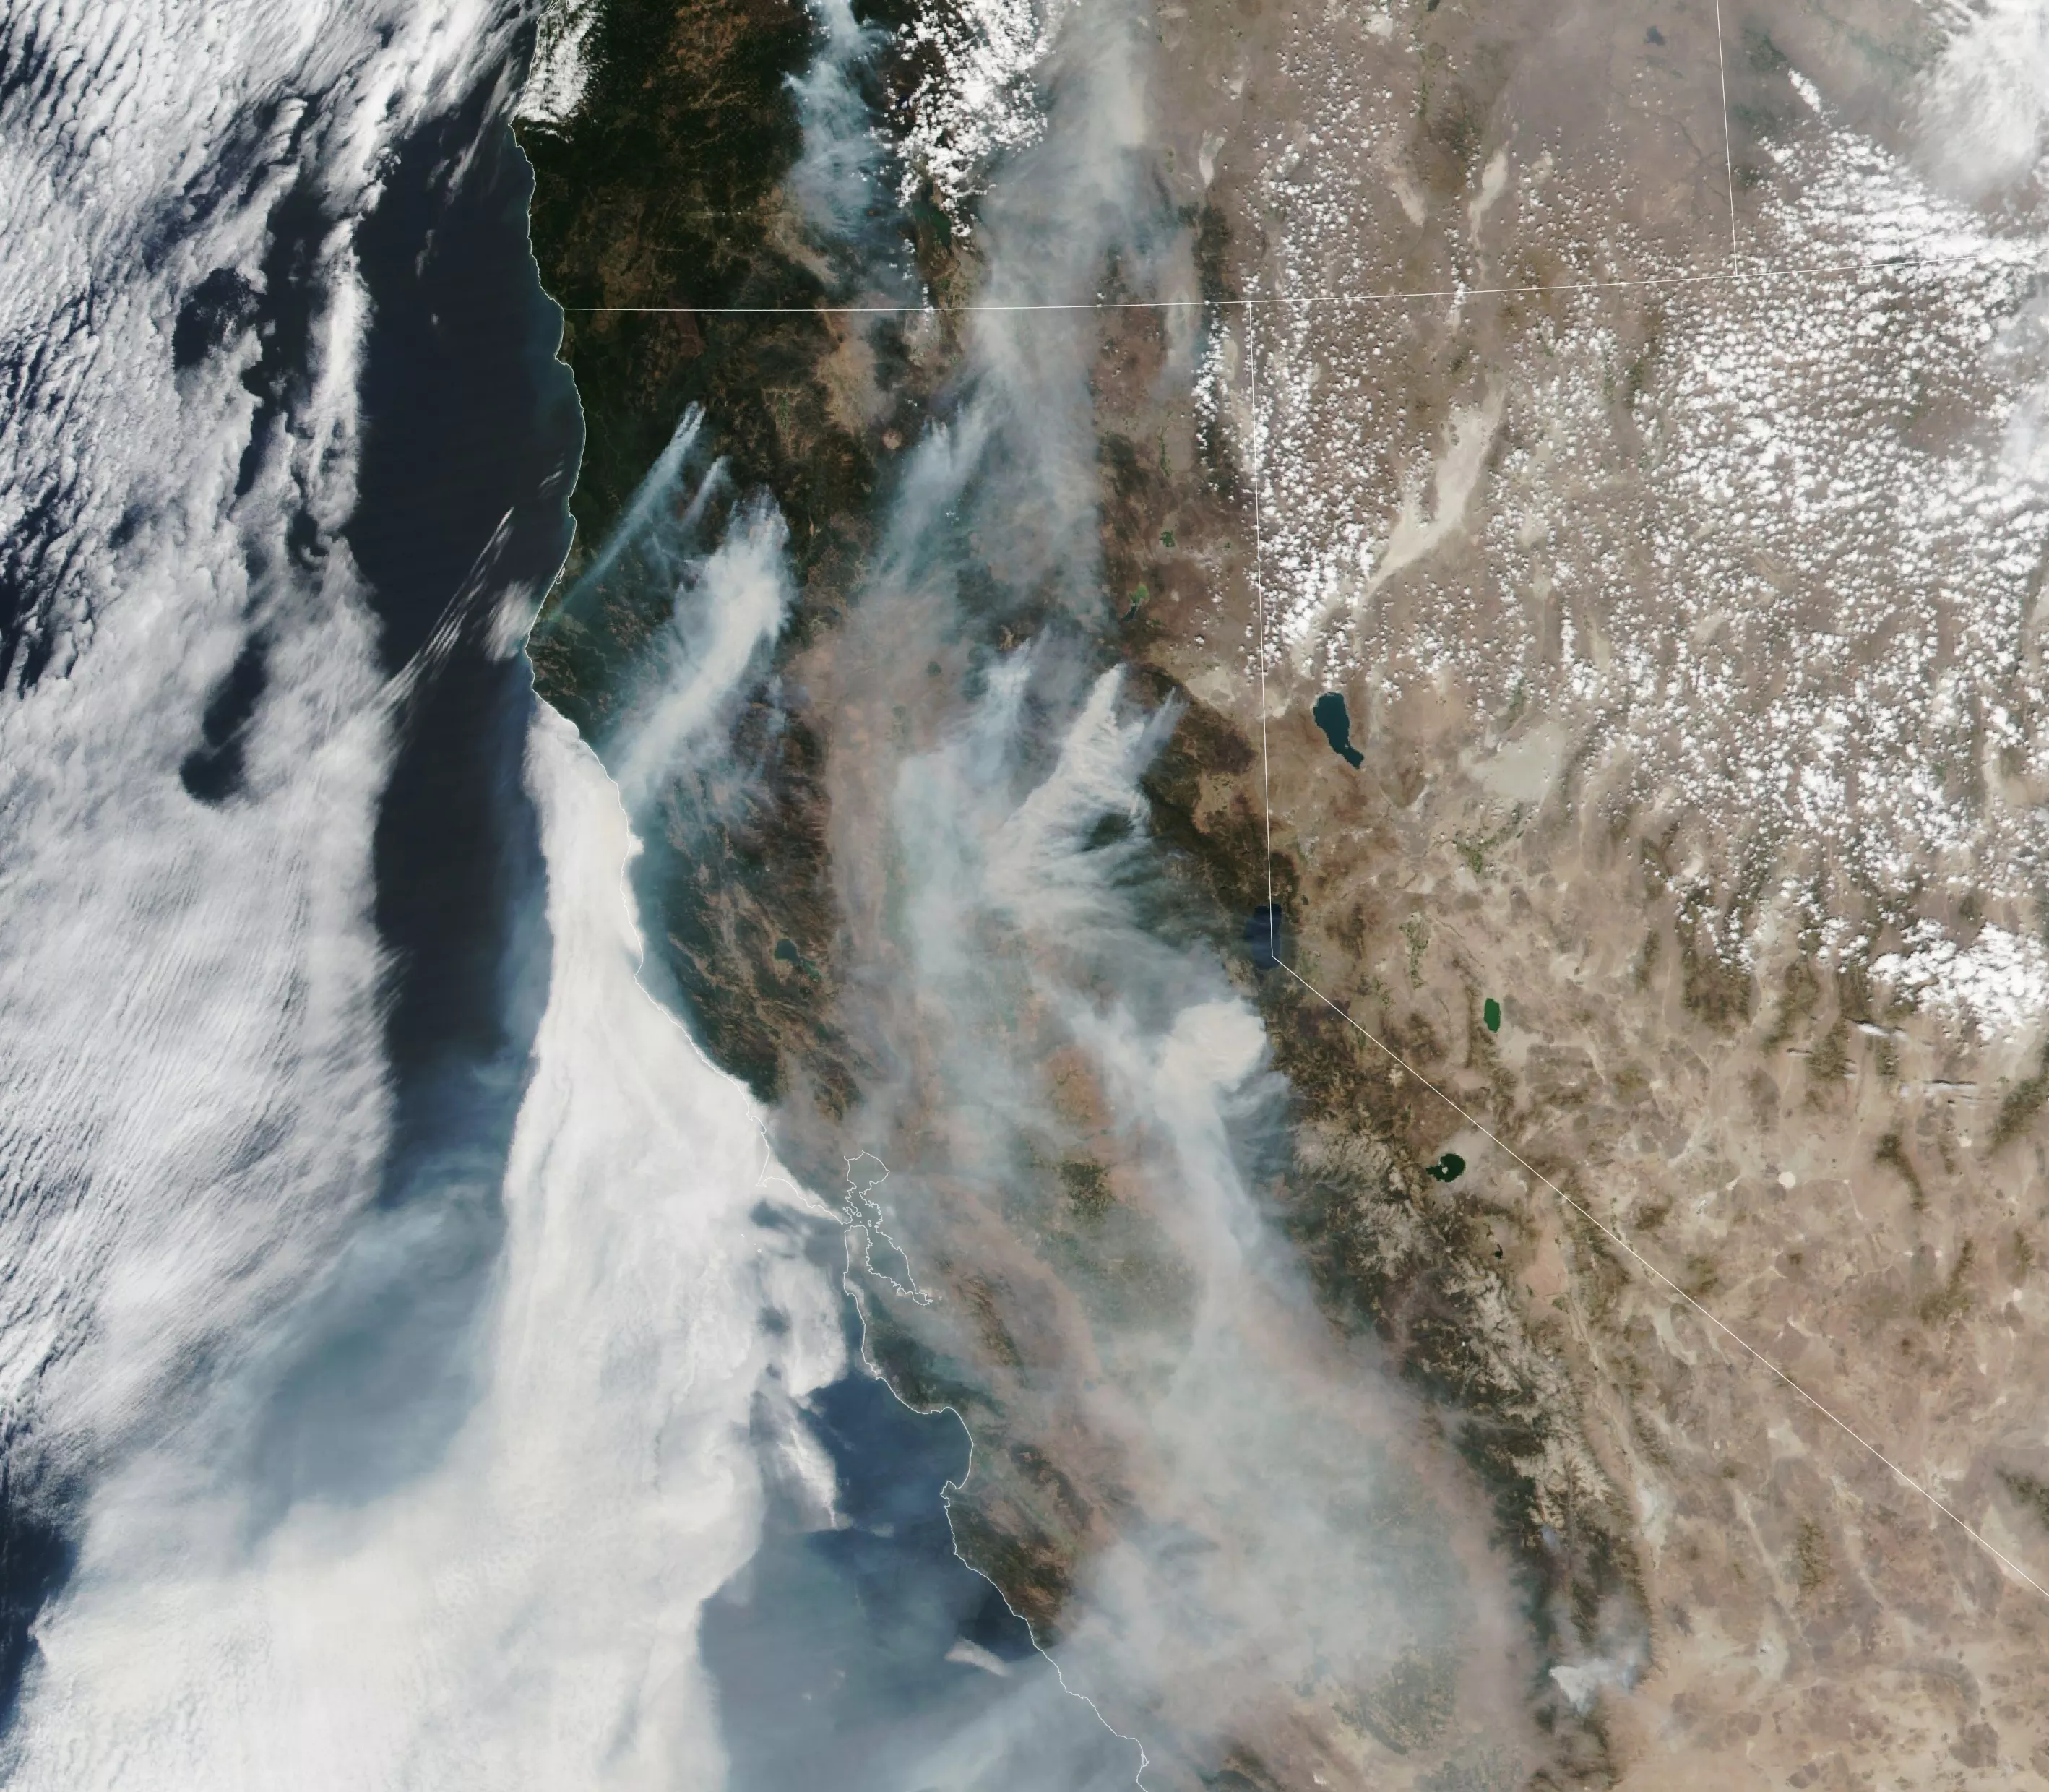
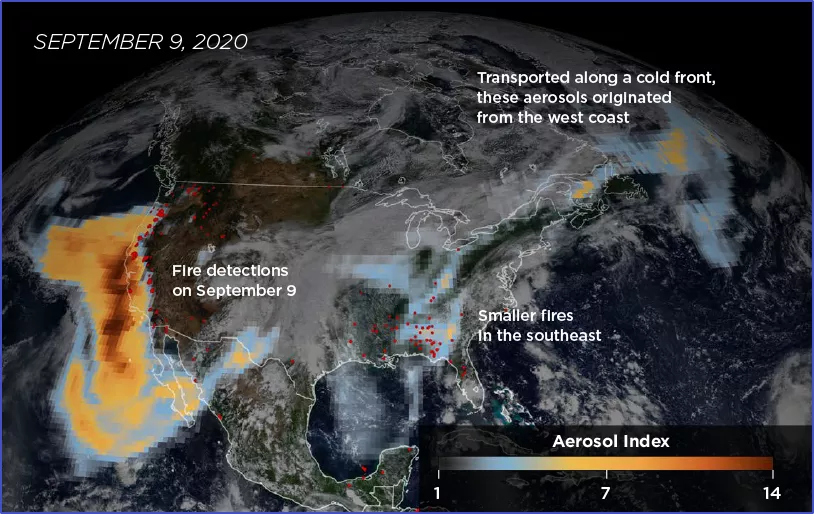
California Wildfires
The Visible Infrared Imaging Radiometer Suite (VIIRS) instrument captures natural-color images of fires, like the massive Dixie fire seen here, the second largest in the state’s history. Scientists also use VIIRS data to detect and map fires in remote places like Alaska, where remote-sensing airplanes don’t fly.
VIIRS also contributes measurements to a model called HRRR-Smoke, which simulates the behavior of wildfire smoke–its thickness and movement, both high above the clouds and on the ground. At the surface, fine smoke particles can penetrate deep into the lungs and aggravate a range of health problems, such as asthma and heart and lung disease. Smoke high in the atmosphere can also affect visibility for pilots and block incoming sunlight.
Image credit: NASA Earth Observatory
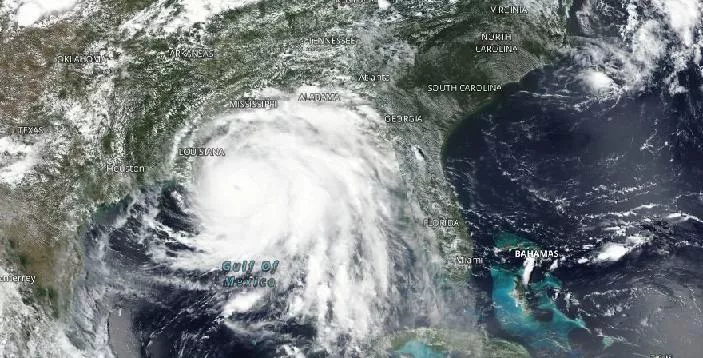
Hurricane Ida
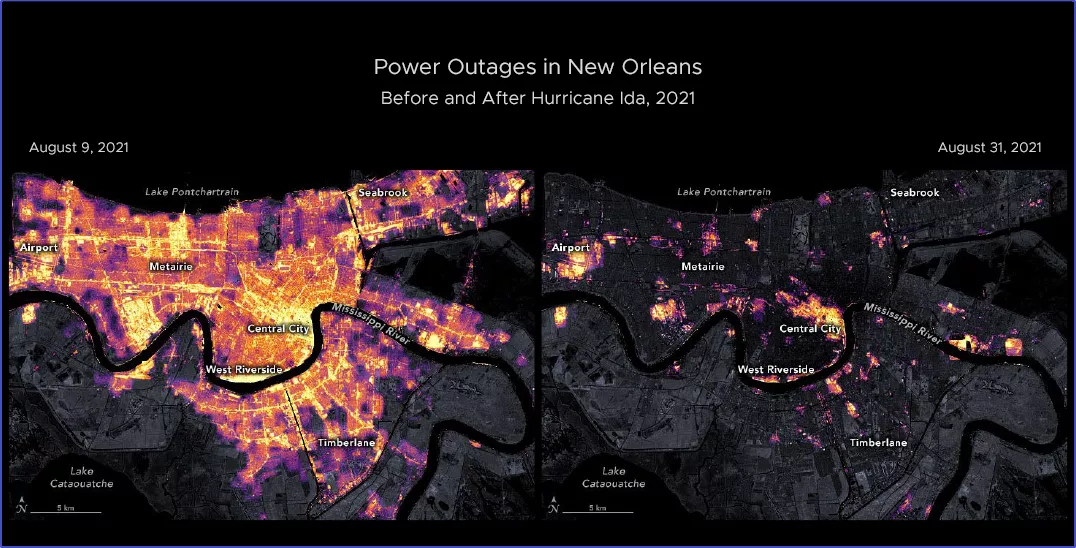
On August 29, 2021, Hurricane Ida made landfall near Port Fourchon, Louisiana, as a strong Category-4 storm–exactly 16 years after Hurricane Katrina struck the area. Ida brought with it torrential rainfall, flooding and sustained winds as high as 150 mph that tore off roofs, downed trees, damaged whole neighborhoods and snuffed out power to more than a million homes. As it approached landfall. Ida’s wind speed, fueled by unusually warm ocean temperatures, atmospheric moisture, and low wind shear, increased by 65 mph in 24 hours. Its remnants then swept northeast, where it caused devastating flooding in New Jersey, New York, Pennsylvania and Connecticut and led to nearly four dozen confirmed deaths.
The Advanced Technology Microwave Sounding (ATMS) instrument took measurements that provided early warning of this storm. By measuring atmospheric temperature and moisture, as well as sea surface temperatures, ATMS gives forecasters data they need to predict how a hurricane will track, along with its intensity. These data are combined with ground-based observations and weather models, and they help people make important decisions on whether they need to take shelter or evacuate.
Image credit: NOAA
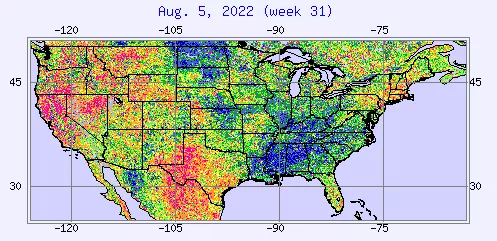
Drought And Heat Waves In The American West
The drought that has gripped the American West since 2000 is the worst the region has seen in at least 1,200 years, according to a recent study in the journal Nature Climate Change.
A product from the VIIRS instrument called the Vegetation Health Index shows vegetation and crop health, represented in color coded maps, like the one seen here. Green and blue indicates lush, healthy growth; red means parched and dry.
This product informs the U.S. Drought Monitor map, which plays an important role in decision-making involving agricultural reimbursements and other government assistance. It is also used regularly by meteorologists at the U.S. Department of Agriculture to monitor global crop growth.
Image Credit: NOAA STAR. The Vegetation Health Index Map shows crop health in the United States on August 5, 2022.
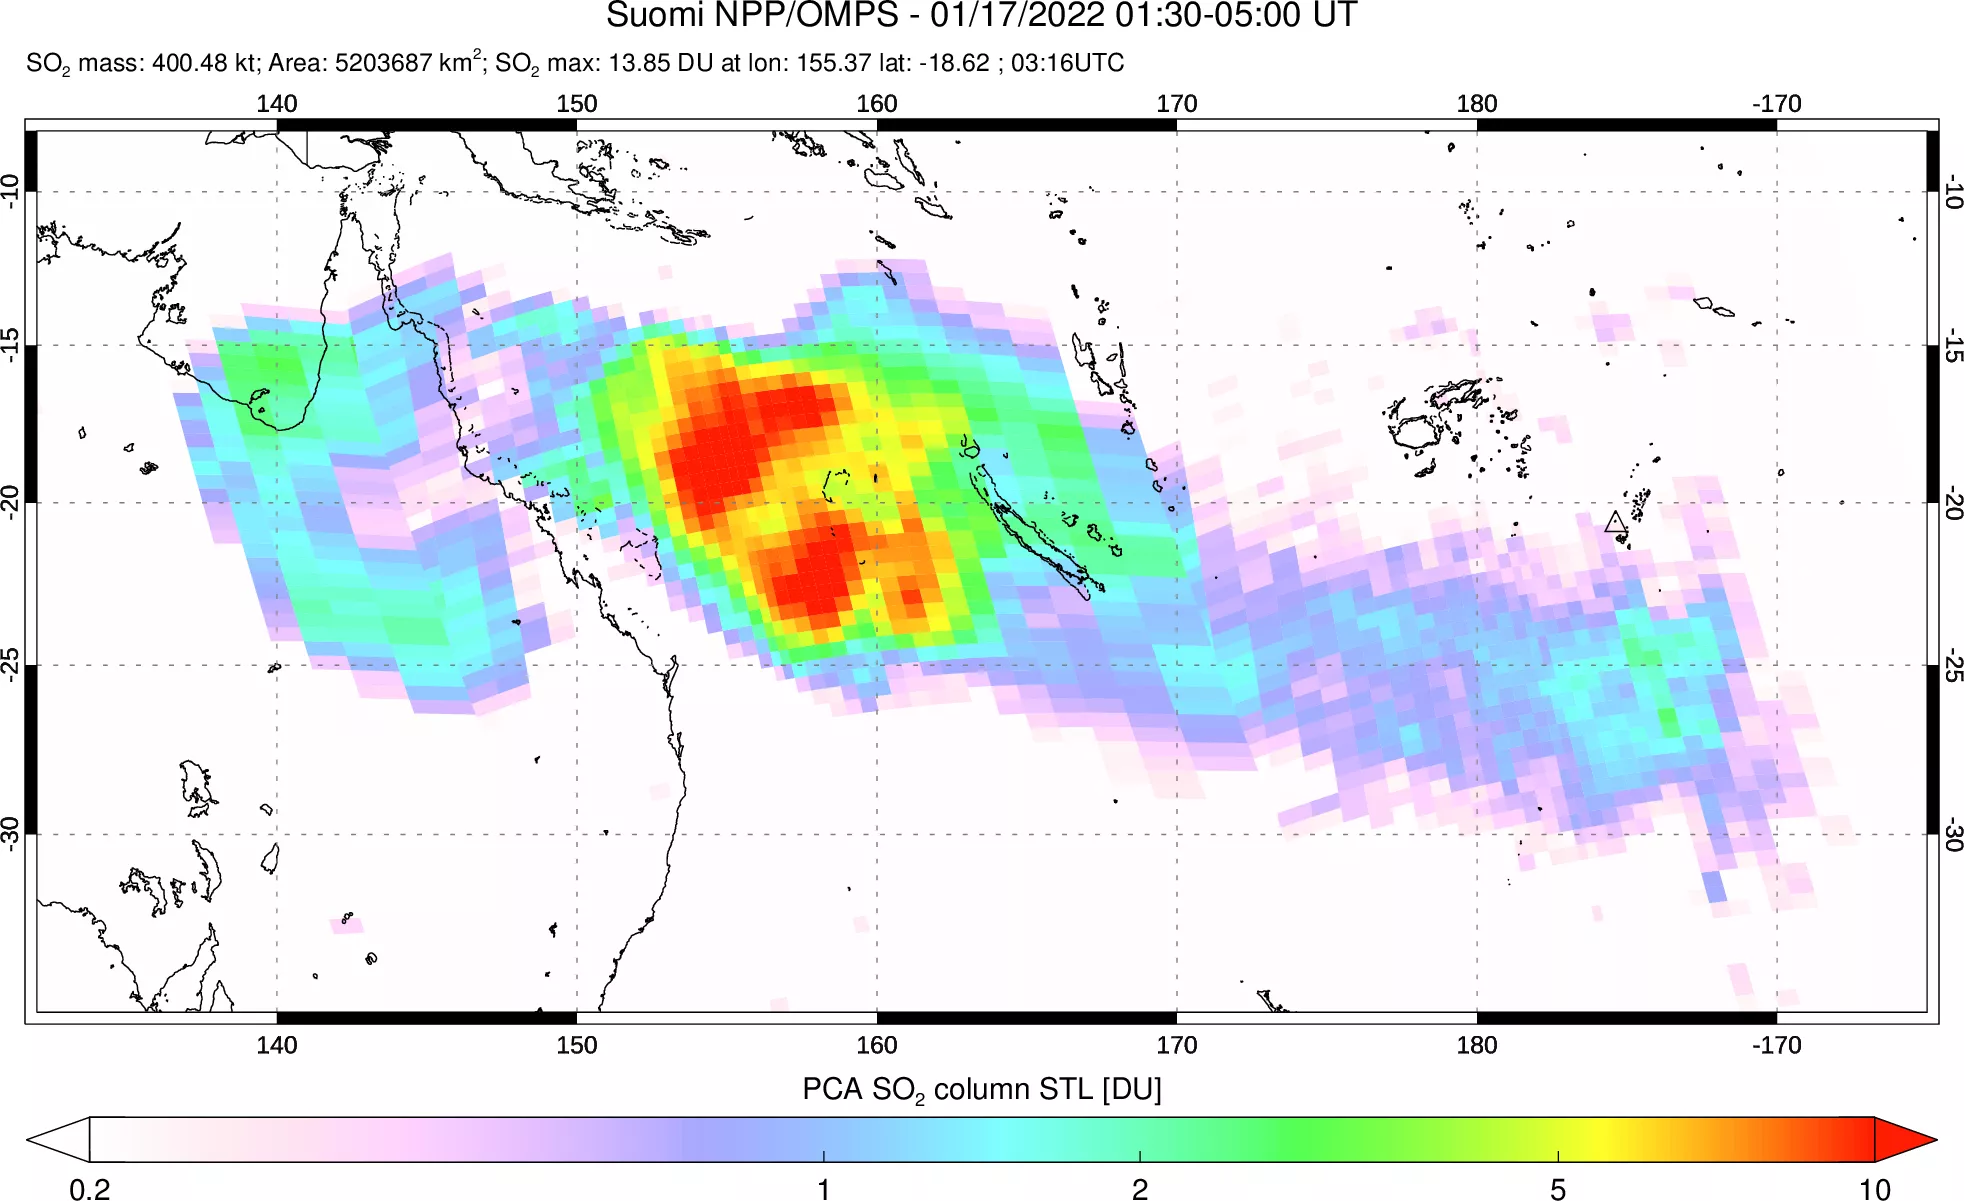
Hunga Tonga-Hunga Ha-Apai Volcanic Eruption
When the Hunga Tonga-Hunga Ha’apai volcano massively erupted on Jan. 11, 2o22, it unleashed a plume of ash and smoke that spewed more than 20 miles into the atmosphere, sent a shockwave around the world and triggered a tsunami that devastated parts of the Pacific island nation of Tonga.
As JPSS satellites passed over the volcano, their Ozone Mapping and Profiler Suite (OMPS) instruments measured sulfur dioxide emissions in the plume spewing from the eruption. The volcanic plume contains particles made of glassy silicate ash and sulfuric acid droplets, as well as gases, both of which are health hazards in high concentrations.
Volcanic clouds can pose threats to aircraft by affecting cabin air quality, damaging the airframe and engines, and reducing visibility.
Image Credit: NASA OMPS processing team. This map shows a stratospheric sulfur dioxide cloud over the Pacific Ocean from January 15, 2022 eruption of Hunga Tonga – Hunga Ha’apai underwater volcano (triangle) near the Pacific Island Nation of Tonga. These measurements were collected on January 17, 2022 by the OMPS instrument on the Suomi-NPP satellite.
Climate Change
The ATMS instrument on JPSS takes measurements of the Earth’s atmosphere and contributes this data to an archive that shows us how the atmosphere has changed over time.
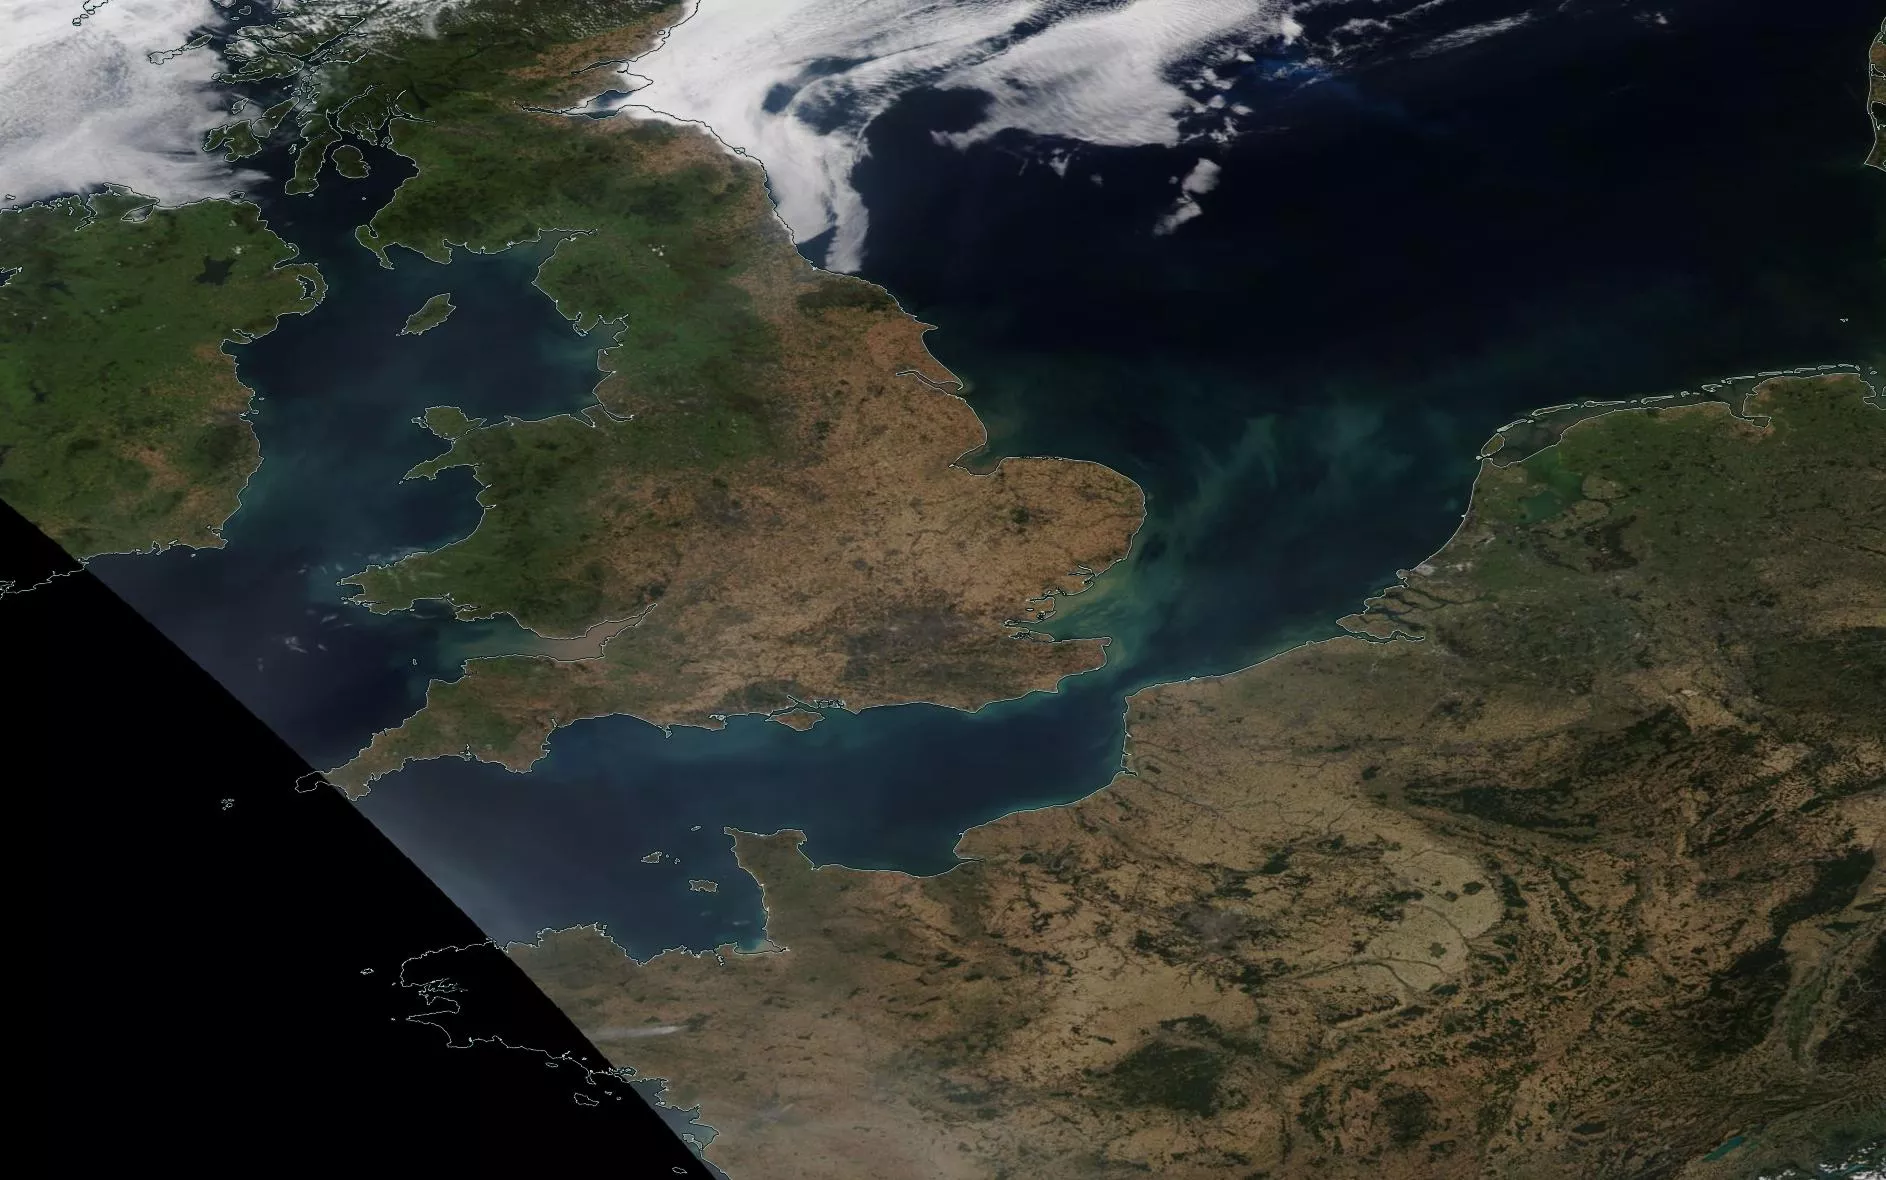
Temperature measurements captured by ATMS and other microwave sounders show us that the troposphere, the lowest layer of the Earth’s atmosphere is warming by .15 degrees Celsius per decade, and .62 degrees over the past 42 years since the first sounder was launched, according to data from NOAA’s Center for Satellite Applications and Research. And that rate is increasing. From August 2002 to December 2020, the warming rate had climbed to an average of .23 degrees Celsius per decade. The warming is caused by greenhouse gases, which act as a blanket, trapping heat in the troposphere.
Meanwhile, in the stratosphere, temperatures are cooling. This is because increasing carbon dioxide in the stratosphere emits more radiation to outer space, causing net energy loss there. Both the warming in the troposphere and the cooling in the stratosphere are indicators of climate change.
Image Credit: NOAA. This VIIRS image captured by NOAA-20 on August 12, 2022 shows how this summer’s dry conditions over Europe are visible from space.
Giant Iceberg Breaks Off Antarctica
Western Side Of Ronne Ice Shelf
In May 2021, an iceberg nearly the size of Delaware sheared off from the edge of Antarctica and floated into the Weddell Sea, where it fractured into pieces. The iceberg, named A-76 by the U.S. National Ice Center, measured 1,668 square miles before breaking up.
The VIIRS instrument on the JPSS satellites observed A-76 splitting from the Ronne Ice Shelf on May 15 and 16 during multiple flyovers.
VIIRS can see ice sheets, ice shelves and icebergs, such as A-76, at a high spatial resolution of 375 meters, and the instrument's wide swath and frequent overpasses at the poles resulted in good coverage of this calving event.
VIIRS also plays an important role in mapping and monitoring glaciers, along with measuring the surface albedo and temperature of ice sheets and the ice concentration, thickness, surface temperature and motion of sea ice.
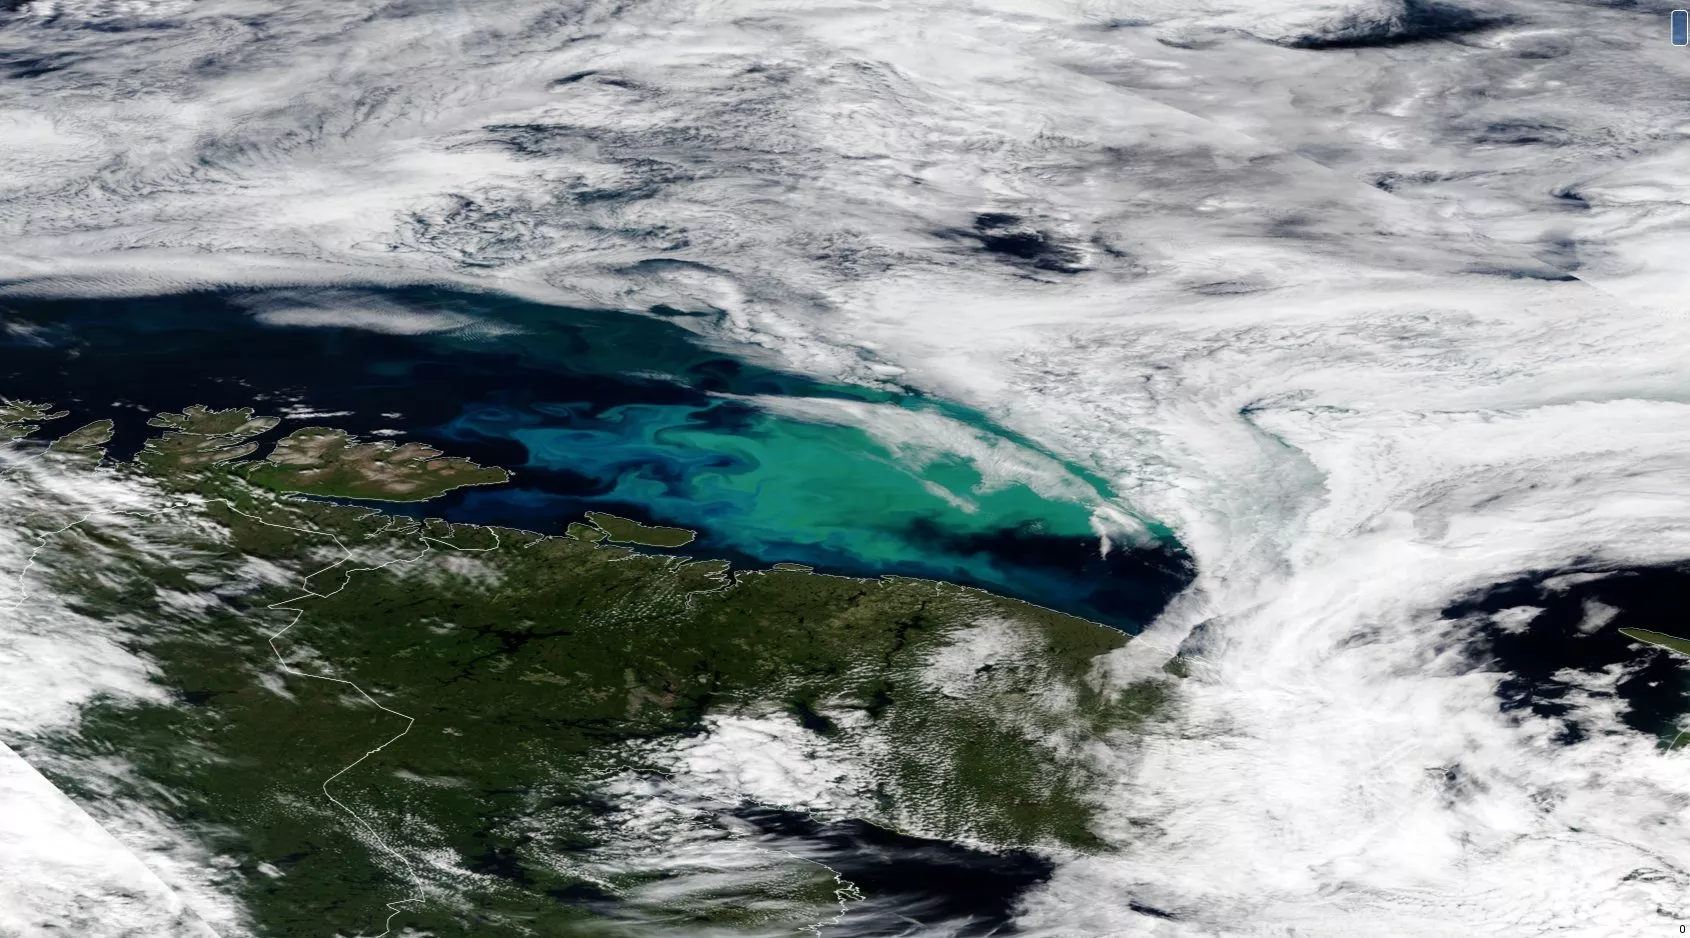
Phytoplankton Bloom
Barents Sea
The JPSS satellite’s VIIRS instrument captures vibrant blue and turquoise swirls, indicating a phytoplankton bloom north of Finland. Phytoplanktons are tiny, microscopic plants that form at the base of food webs in marine ecosystems and thrive in Arctic waters. They are common in this location in late July and August, thanks to a combination of 24-hour sunlight, minimal ice cover and relatively warm surface waters. This image is from the Suomi-NPP satellite.
Image Credit: NOAA. The vibrant blue and turquoise swirls in the center of the image show a phytoplankton bloom north of Finland.
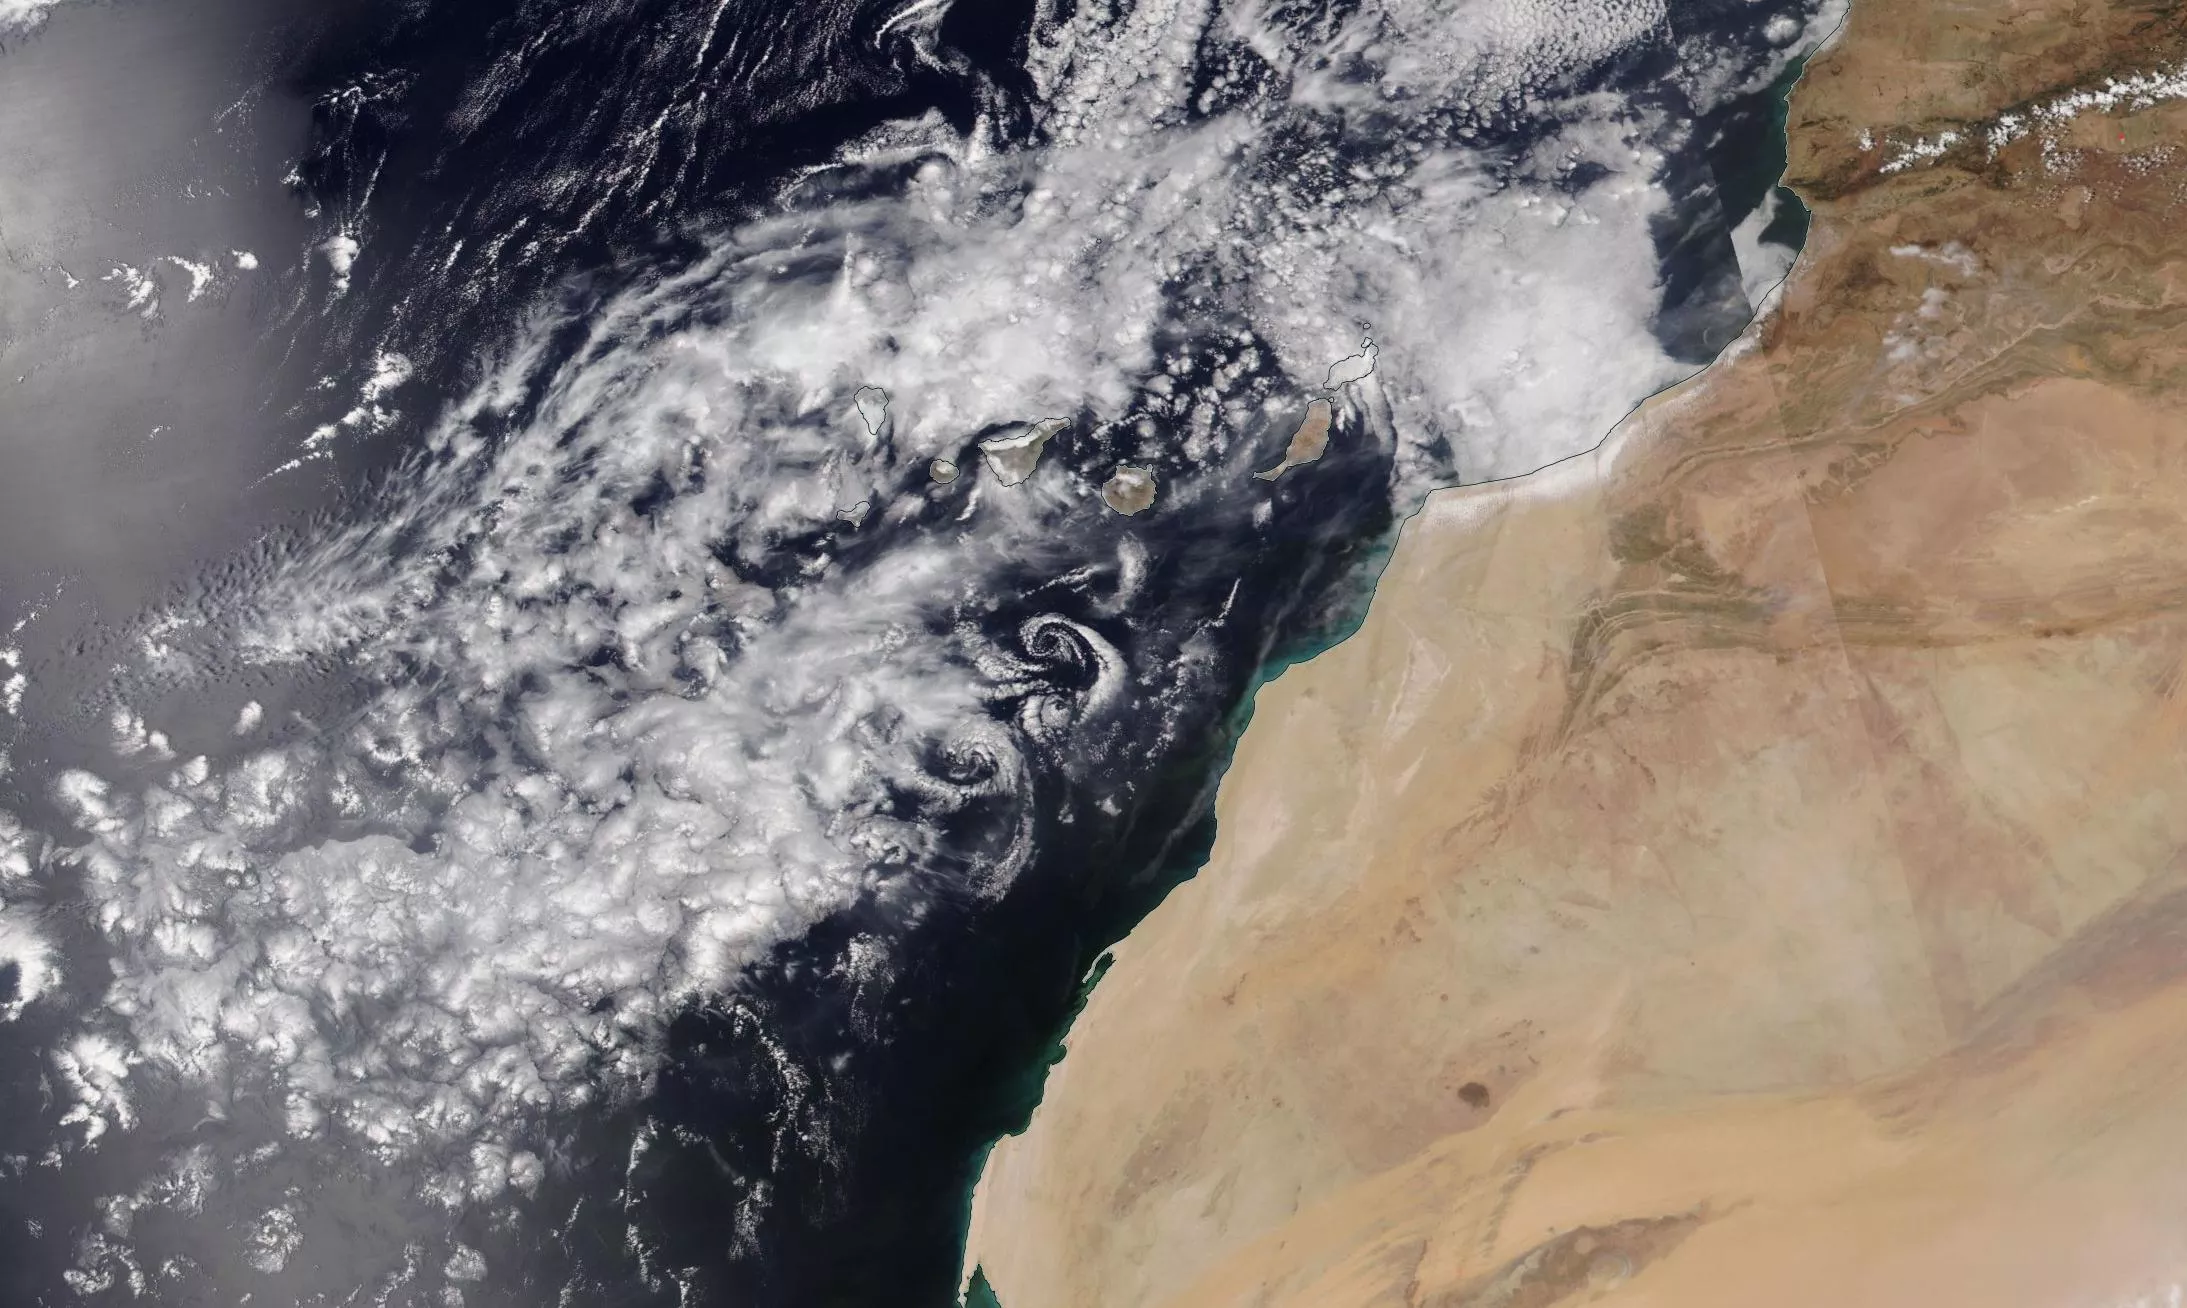
Saharan Dust Storm
Northwest Africa
For several days in February and March 2022, strong winds from the Sahara Desert carried sand and dust east off the coast of Africa, over the Atlantic Ocean and north toward Europe. The Saharan Air Layer, a mass of dry, dusty air that forms over the desert and extends as high as 20,000 feet into the atmosphere, can travel several thousand miles, grounding flights, turning the sky orange and suppressing cyclone development during hurricane season, but also bringing minerals that replenish soil nutrients as far away as the Amazon Rainforest.
The JPSS satellites’ OMPS instruments measure aerosols from the dust plumes, monitoring air quality and visibility for aircraft.
Cloud Formations
Guadalupe Island
The JPSS satellite’s VIIRS instrument captures interesting cloud formations, like these von Karman vortices over Guadalupe Island, off the west coast of Mexico’s Baja California. These are caused by mountaintops, volcanoes or islands that disrupt the flow of wind, causing air and clouds to rotate into a spiral, similar to the way boulders create downstream eddies in rivers. Windspeed determines the shape of the clouds.
Image Credit: NOAA
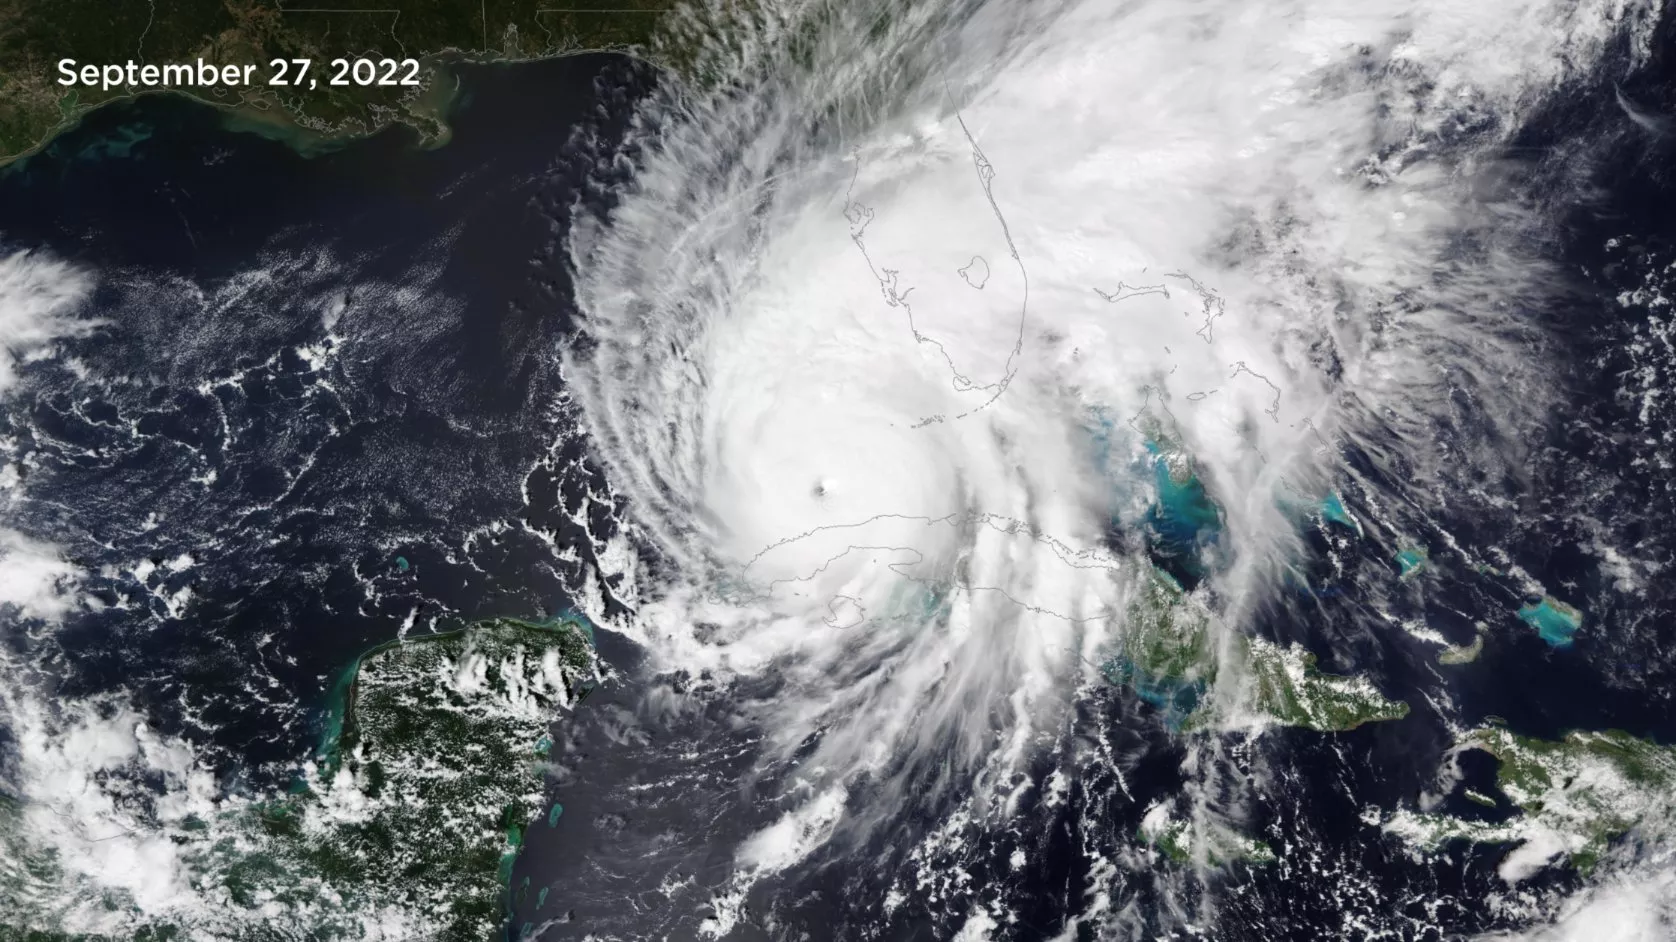
Hurricane Ian
Cayo Costa, Florida
Hurricane Ian, one of the most powerful storms ever recorded in the United States, made landfall to the west of Ft. Myers, Fla., on Sept. 28 as a Category 4 hurricane after causing widespread damage in western Cuba. In Florida, the storm destroyed entire coastal communities and unleashed a dangerous storm surge before moving up the coast, where it made a second landfall in South Carolina on Sept. 30. The storm was responsible for more than 120 deaths, according to state and county officials.
This image, captured by the NOAA-20 satellite on Sept. 27, shows the massive, well-organized storm approaching Florida’s coast.
Helps Us Understand Extreme Weather
Click on the red dots in this spinning planet to see the role the JPSS satellites have played in major weather events:
California Wildfires
The Visible Infrared Imaging Radiometer Suite (VIIRS) instrument captures natural-color images of fires, like the massive Dixie fire seen here, the second largest in the state’s history. Scientists also use VIIRS data to detect and map fires in remote places like Alaska, where remote-sensing airplanes don’t fly.
VIIRS also contributes measurements to a model called HRRR-Smoke, which simulates the behavior of wildfire smoke–its thickness and movement, both high above the clouds and on the ground. At the surface, fine smoke particles can penetrate deep into the lungs and aggravate a range of health problems, such as asthma and heart and lung disease. Smoke high in the atmosphere can also affect visibility for pilots and block incoming sunlight.
Image credit: NASA Earth Observatory
Hurricane Ida
On August 29, 2021, Hurricane Ida made landfall near Port Fourchon, Louisiana, as a strong Category-4 storm–exactly 16 years after Hurricane Katrina struck the area. Ida brought with it torrential rainfall, flooding and sustained winds as high as 150 mph that tore off roofs, downed trees, damaged whole neighborhoods and snuffed out power to more than a million homes. As it approached landfall. Ida’s wind speed, fueled by unusually warm ocean temperatures, atmospheric moisture, and low wind shear, increased by 65 mph in 24 hours. Its remnants then swept northeast, where it caused devastating flooding in New Jersey, New York, Pennsylvania and Connecticut and led to nearly four dozen confirmed deaths.
The Advanced Technology Microwave Sounding (ATMS) instrument took measurements that provided early warning of this storm. By measuring atmospheric temperature and moisture, as well as sea surface temperatures, ATMS gives forecasters data they need to predict how a hurricane will track, along with its intensity. These data are combined with ground-based observations and weather models, and they help people make important decisions on whether they need to take shelter or evacuate.
Image credit: NOAA
Drought And Heat Waves In The American West
The drought that has gripped the American West since 2000 is the worst the region has seen in at least 1,200 years, according to a recent study in the journal Nature Climate Change.
A product from the VIIRS instrument called the Vegetation Health Index shows vegetation and crop health, represented in color coded maps, like the one seen here. Green and blue indicates lush, healthy growth; red means parched and dry.
This product informs the U.S. Drought Monitor map, which plays an important role in decision-making involving agricultural reimbursements and other government assistance. It is also used regularly by meteorologists at the U.S. Department of Agriculture to monitor global crop growth.
Image Credit: NOAA STAR. The Vegetation Health Index Map shows crop health in the United States on August 5, 2022.
Hunga Tonga-Hunga Ha-Apai Volcanic Eruption
When the Hunga Tonga-Hunga Ha’apai volcano massively erupted on Jan. 11, 2o22, it unleashed a plume of ash and smoke that spewed more than 20 miles into the atmosphere, sent a shockwave around the world and triggered a tsunami that devastated parts of the Pacific island nation of Tonga.
As JPSS satellites passed over the volcano, their Ozone Mapping and Profiler Suite (OMPS) instruments measured sulfur dioxide emissions in the plume spewing from the eruption. The volcanic plume contains particles made of glassy silicate ash and sulfuric acid droplets, as well as gases, both of which are health hazards in high concentrations.
Volcanic clouds can pose threats to aircraft by affecting cabin air quality, damaging the airframe and engines, and reducing visibility.
Image Credit: NASA OMPS processing team. This map shows a stratospheric sulfur dioxide cloud over the Pacific Ocean from January 15, 2022 eruption of Hunga Tonga – Hunga Ha’apai underwater volcano (triangle) near the Pacific Island Nation of Tonga. These measurements were collected on January 17, 2022 by the OMPS instrument on the Suomi-NPP satellite.
Climate Change
The ATMS instrument on JPSS takes measurements of the Earth’s atmosphere and contributes this data to an archive that shows us how the atmosphere has changed over time.
Temperature measurements captured by ATMS and other microwave sounders show us that the troposphere, the lowest layer of the Earth’s atmosphere is warming by .15 degrees Celsius per decade, and .62 degrees over the past 42 years since the first sounder was launched, according to data from NOAA’s Center for Satellite Applications and Research. And that rate is increasing. From August 2002 to December 2020, the warming rate had climbed to an average of .23 degrees Celsius per decade. The warming is caused by greenhouse gases, which act as a blanket, trapping heat in the troposphere.
Meanwhile, in the stratosphere, temperatures are cooling. This is because increasing carbon dioxide in the stratosphere emits more radiation to outer space, causing net energy loss there. Both the warming in the troposphere and the cooling in the stratosphere are indicators of climate change.
Image Credit: NOAA. This VIIRS image captured by NOAA-20 on August 12, 2022 shows how this summer’s dry conditions over Europe are visible from space.
Giant Iceberg Breaks Off Antarctica
Western Side Of Ronne Ice Shelf
In May 2021, an iceberg nearly the size of Delaware sheared off from the edge of Antarctica and floated into the Weddell Sea, where it fractured into pieces. The iceberg, named A-76 by the U.S. National Ice Center, measured 1,668 square miles before breaking up.
The VIIRS instrument on the JPSS satellites observed A-76 splitting from the Ronne Ice Shelf on May 15 and 16 during multiple flyovers.
VIIRS can see ice sheets, ice shelves and icebergs, such as A-76, at a high spatial resolution of 375 meters, and the instrument's wide swath and frequent overpasses at the poles resulted in good coverage of this calving event.
VIIRS also plays an important role in mapping and monitoring glaciers, along with measuring the surface albedo and temperature of ice sheets and the ice concentration, thickness, surface temperature and motion of sea ice.
Phytoplankton Bloom
Barents Sea
The JPSS satellite’s VIIRS instrument captures vibrant blue and turquoise swirls, indicating a phytoplankton bloom north of Finland. Phytoplanktons are tiny, microscopic plants that form at the base of food webs in marine ecosystems and thrive in Arctic waters. They are common in this location in late July and August, thanks to a combination of 24-hour sunlight, minimal ice cover and relatively warm surface waters. This image is from the Suomi-NPP satellite.
Image Credit: NOAA. The vibrant blue and turquoise swirls in the center of the image show a phytoplankton bloom north of Finland.
Saharan Dust Storm
Northwest Africa
For several days in February and March 2022, strong winds from the Sahara Desert carried sand and dust east off the coast of Africa, over the Atlantic Ocean and north toward Europe. The Saharan Air Layer, a mass of dry, dusty air that forms over the desert and extends as high as 20,000 feet into the atmosphere, can travel several thousand miles, grounding flights, turning the sky orange and suppressing cyclone development during hurricane season, but also bringing minerals that replenish soil nutrients as far away as the Amazon Rainforest.
The JPSS satellites’ OMPS instruments measure aerosols from the dust plumes, monitoring air quality and visibility for aircraft.
Cloud Formations
Guadalupe Island
The JPSS satellite’s VIIRS instrument captures interesting cloud formations, like these von Karman vortices over Guadalupe Island, off the west coast of Mexico’s Baja California. These are caused by mountaintops, volcanoes or islands that disrupt the flow of wind, causing air and clouds to rotate into a spiral, similar to the way boulders create downstream eddies in rivers. Windspeed determines the shape of the clouds.
Image Credit: NOAA
Hurricane Ian
Cayo Costa, Florida
Hurricane Ian, one of the most powerful storms ever recorded in the United States, made landfall to the west of Ft. Myers, Fla., on Sept. 28 as a Category 4 hurricane after causing widespread damage in western Cuba. In Florida, the storm destroyed entire coastal communities and unleashed a dangerous storm surge before moving up the coast, where it made a second landfall in South Carolina on Sept. 30. The storm was responsible for more than 120 deaths, according to state and county officials.
This image, captured by the NOAA-20 satellite on Sept. 27, shows the massive, well-organized storm approaching Florida’s coast.

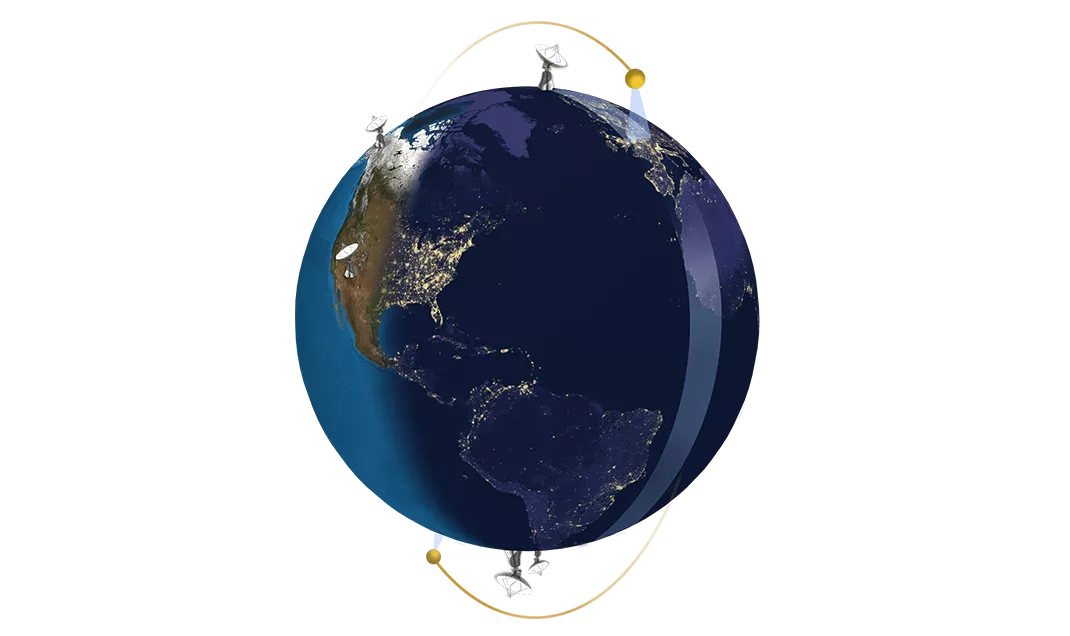
More Data, More Often
Satellites travel fast, but the amount of time it takes to circle the planet is too long to wait to get important weather data into people’s hands.
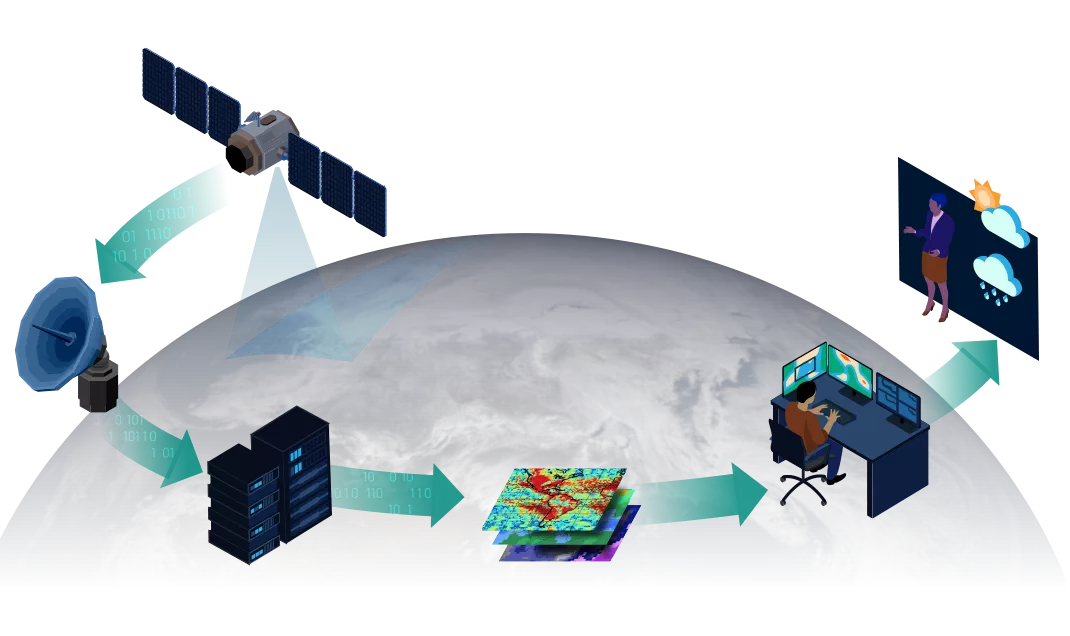
That’s why there are two primary ground stations that collect data from JPSS satellites. One is located near the North Pole, on Norway’s remote Svalbard Islands. The other is at the McMurdo Station in Antarctica. Secondary sites that serve as backups are located in Fairbanks, Alaska; White Sands, New Mexico; and Troll, Antarctica.
More Data, More Often
Satellites travel fast, but the amount of time it takes to circle the planet is too long to wait to get important weather data into people’s hands.
That’s why there are two primary ground stations that collect data from JPSS satellites. One is located near the North Pole, on Norway’s remote Svalbard Islands. The other is at the McMurdo Station in Antarctica. Secondary sites that serve as backups are located in Fairbanks, Alaska; White Sands, New Mexico; and Troll, Antarctica.
Antennas at each ground station collect data from the satellites as they pass over. Receivers capture that data, which are transformed into records and fed into powerful computer models. Those models inform the smartphone apps and television and radio reports where you get your weather.
Data are also delivered via direct broadcast, which allows users to access information quickly using their own antennas.

Who Uses The Data?
These people all rely on JPSS data to tackle weather and climate concerns:

JPSS Instruments
JPSS carries four instruments to monitor weather and climate.
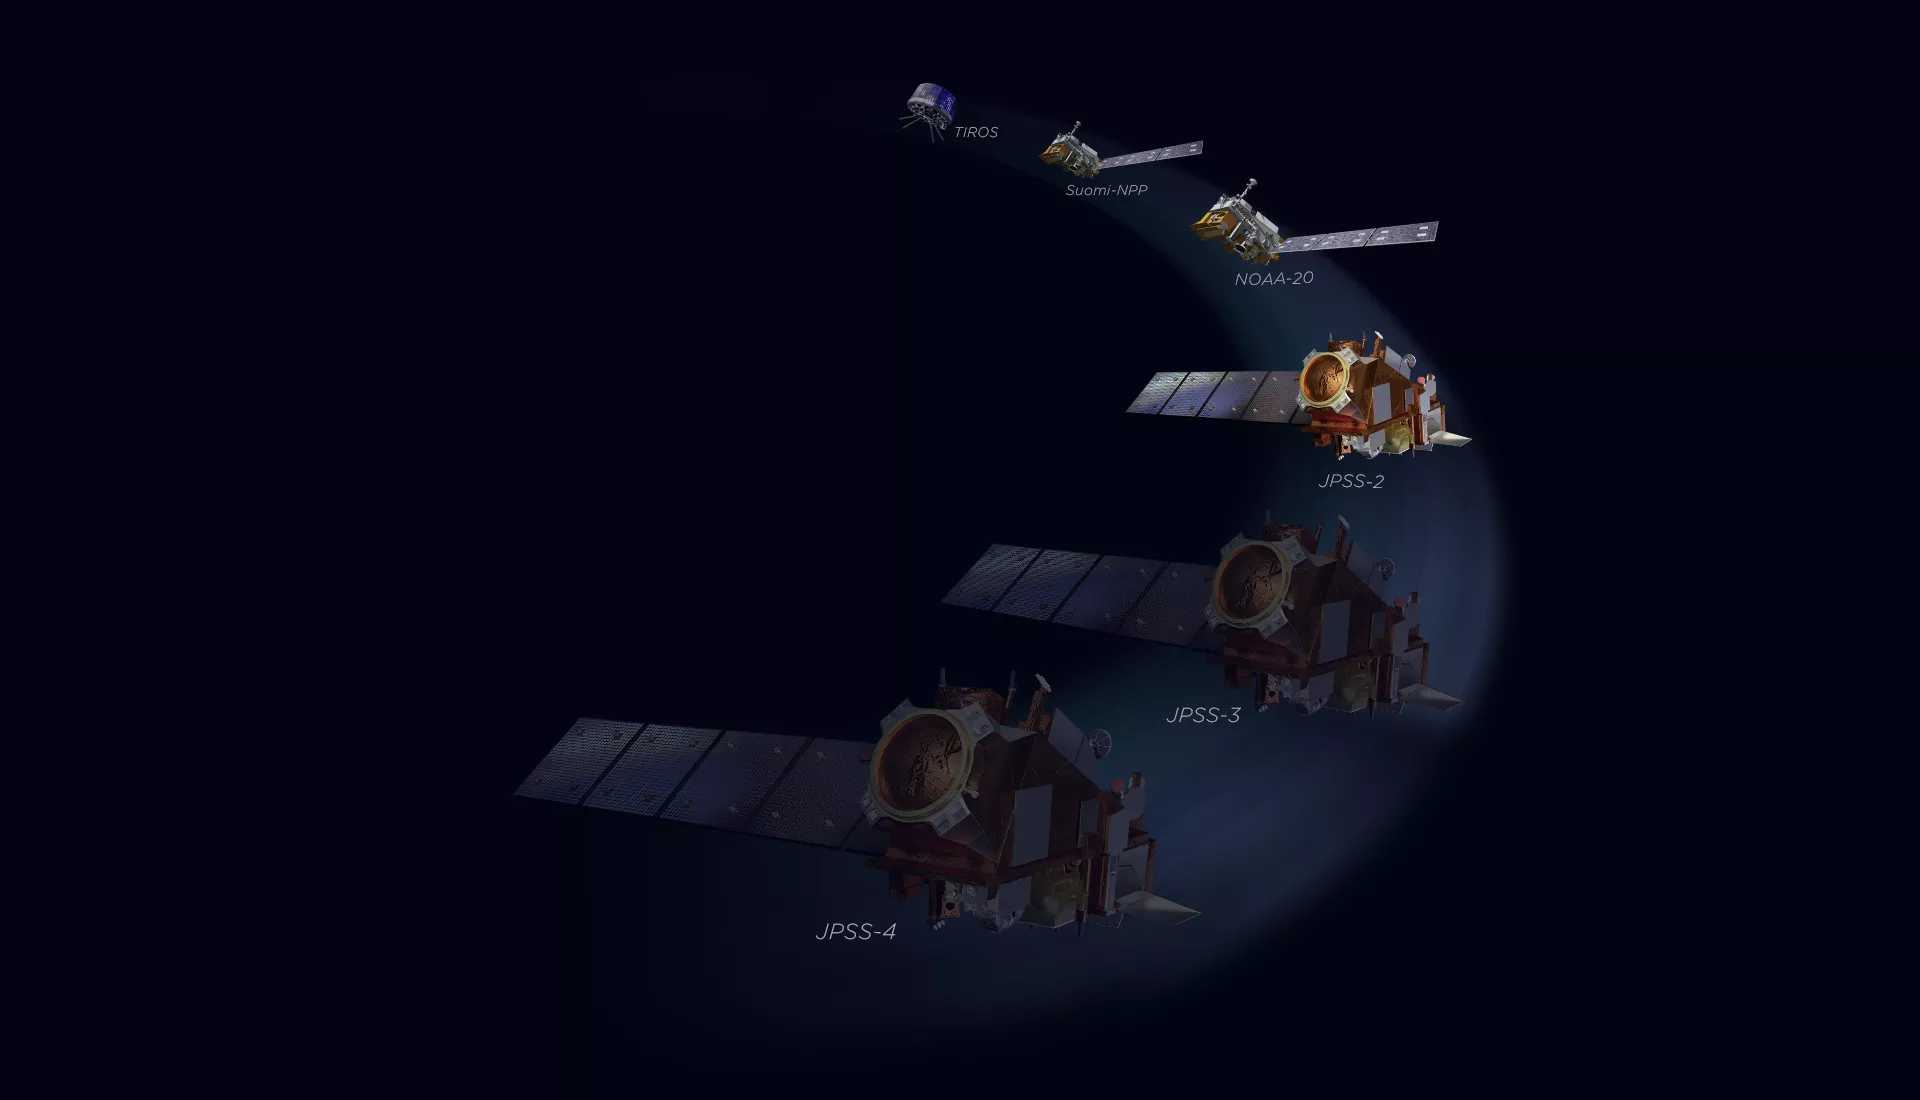
How JPSS Fits Into The Fleet
JPSS-2 launched from the Vandenberg Space Force Base in Lompoc, California on November 10, 2022.
JPSS-2 is part of a long history of NOAA and NASA satellites that date back to 1960, when the first weather satellite, TIROS-1 launched from Cape Canaveral in Florida. And it will be followed by two more nearly identical satellites, JPSS-3 and JPSS-4. This means we’ll likely have data from these satellites until the late 2030s.

JPSS Place You Love Challenge
The community submitted over 500 photos of beautiful places across the world for the JPSS Place You Love Challenge. Enjoy this video compilation of all of the photos and learn more about how JPSS protects our home.