
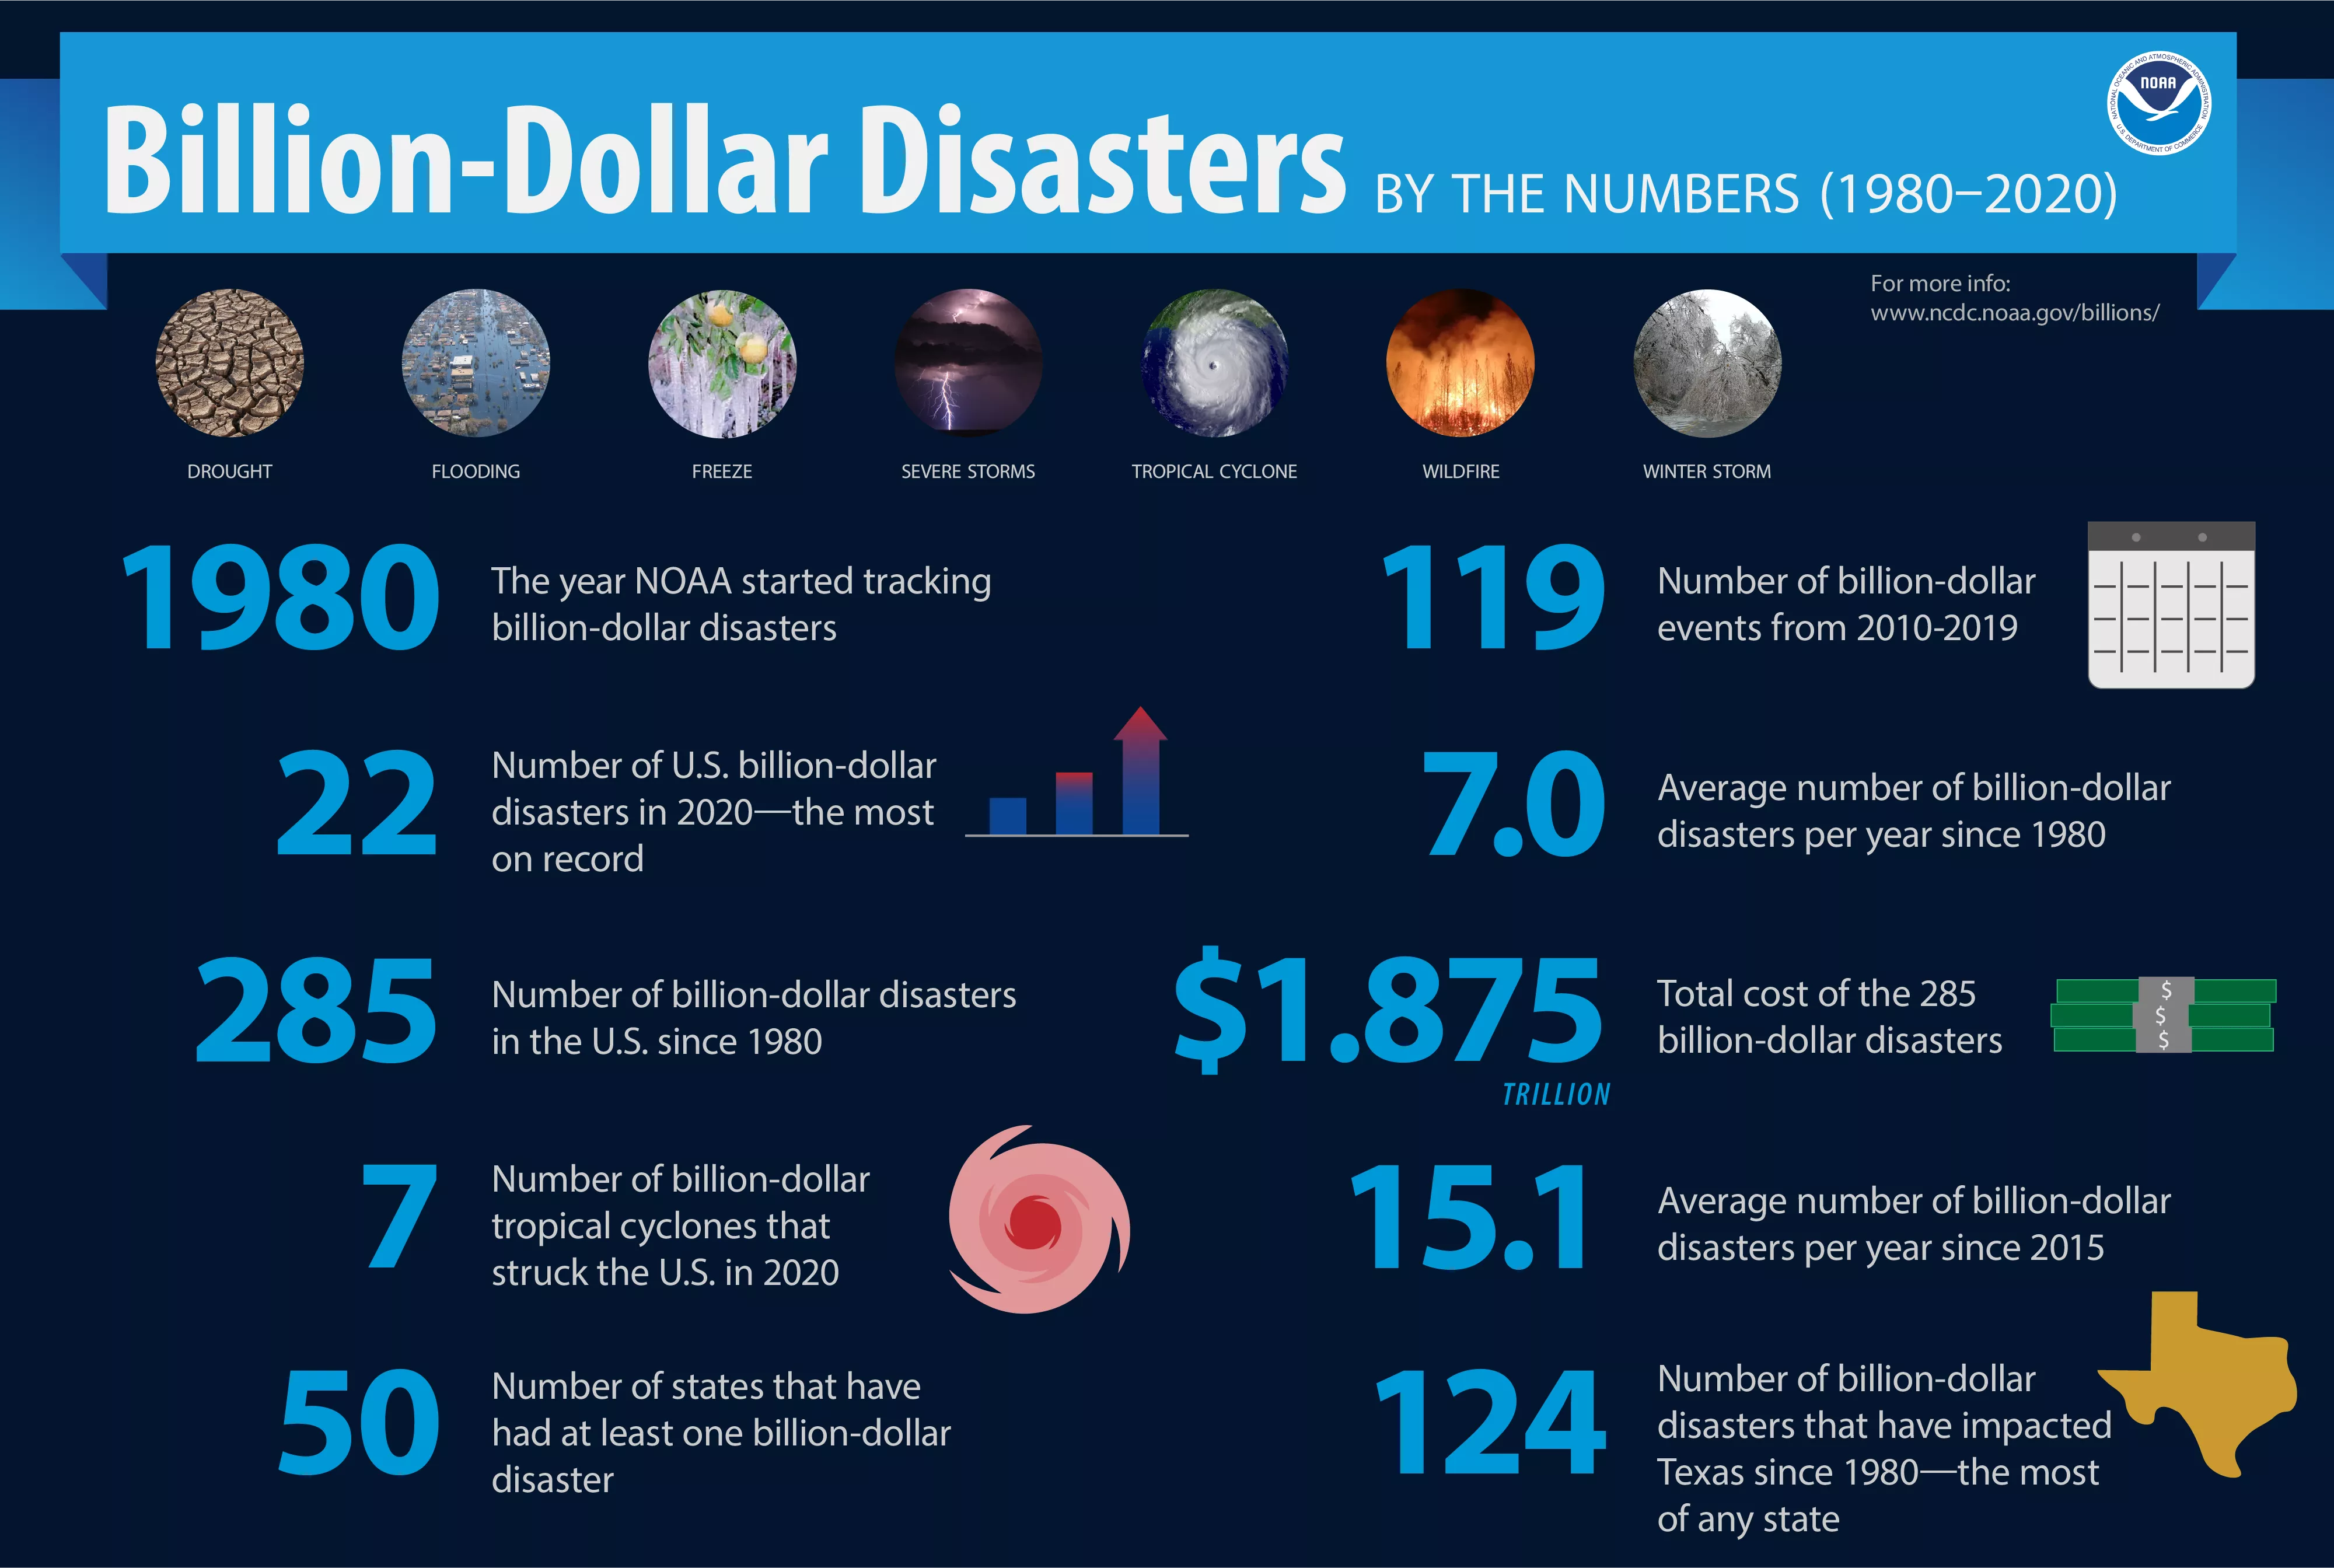
From a natural disaster’s perspective, 2020 was an unprecedented year for the United States. There were 22 billion-dollar weather and climate disasters across the nation, blowing away the previous record of 16 set in 2017 and 2011. It’s estimated that all 22 disasters amounted to a total cost of $95.0 billion—the fourth-highest price tag since 1980, the year NOAA started keeping tabs on the nation’s disasters.

Adam Smith is lead scientist for NOAA National Centers for Environmental Information’s (NCEI’s) U.S. Billion-dollar Weather and Climate Disasters.
Over the last decade, he has led research, developed new data partnerships, and gained national and international experience merging environmental and social-science data into research tools for studying the impacts and costs of natural disasters.
As 2020 was coming to a close, we sat down with Adam to ask him a few questions about billion-dollar disasters in the United States.
Last year was a standout for billion-dollar disasters in the United States. What were some of the records set or broken in 2020?
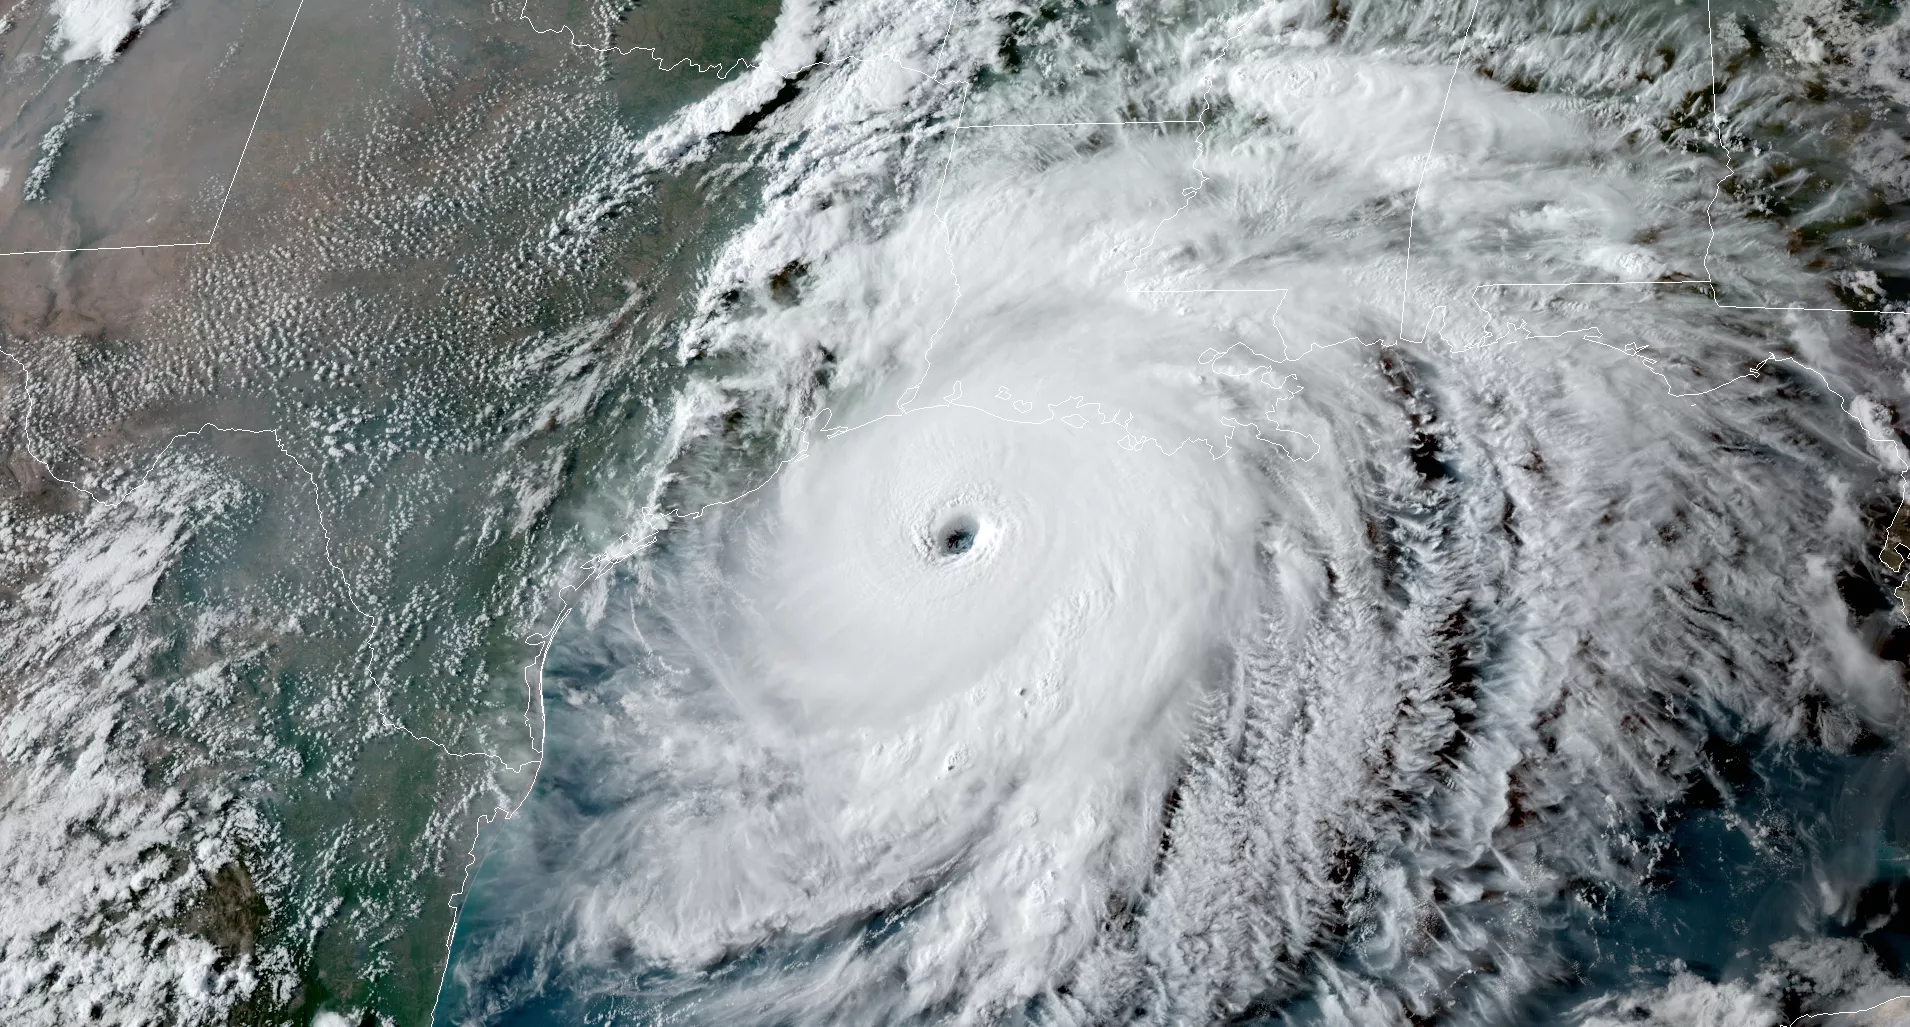
It was a historic year of extremes. Most strikingly, this included the record-breaking Atlantic hurricane and Western wildfire seasons. Many central states also endured a severe derecho of historic intensity that produced impacts similar to an inland hurricane.
One new record was the 30 named storms across the Atlantic and Gulf of Mexico, topping the 2005 record of 28 named storms. Also, 12 of these storms made U.S. landfall, breaking the record of 9 set in 1916. Regarding impacts, 7 of the 12 landfalling storms produced at least $1 billion in damage—also a new annual record.
Additionally, California more than doubled its previous record, with more than 4.1 million acres burned by wildfires in 2020. The year continued the trend of longer and more destructive Western wildfire seasons.
The Central states also experienced a historic severe weather event—the August 10 derecho—that produced damage costs of $11.0 billion. The derecho’s damage to infrastructure and crops is the third severe weather event (since 1980) to top $10.0 billion (inflation-adjusted costs), joining the late-April and May 2011 tornado outbreaks across the Southeastern and Central states.
What are the most costly weather and climate disasters in the U.S.?
Tropical cyclones are historically the most costly of the weather and climate disasters. Since 1980, the U.S. has sustained 52 separate hurricane or tropical storm events where overall damages/costs reached or exceeded $1 billion (including Consumer Price Index (CPI) adjustment to 2020). The total cost of these 52 events is $997.3 billion—averaging $19.2 billion per event. A hurricane’s damage potential from high wind, storm surge, extreme rainfall and flooding coupled with a densely populated coastline is a risky combination that often produces costly events.
In three of the last four years, however, western wildfires have become much more costly disasters—particularly in California. In 2020 alone, wildfires burned the most acres on record in the U.S.—10.27 million—at a cost of $16.5 billion.
Are billion-dollar disasters increasing in frequency and cost, and what is the impact of climate change?
The number and cost of disasters have been increasing over time due to a combination of increased exposure (i.e., values at risk of possible loss), vulnerability (i.e., where we build; how we build), and climate change, which is increasing the frequency of some types of extremes that lead to billion-dollar disasters.
More specifically, these trends are further complicated by the fact that much of the growth has taken place in vulnerable areas like coasts and river floodplains. Vulnerability is especially high where building codes are insufficient for reducing damage from extreme events.
Climate change is also playing a role in the increasing frequency of some types of extreme weather that lead to billion-dollar disasters—most notably the rise in vulnerability to drought, lengthening wildfire seasons in the Western states, and the potential for extremely heavy rainfall becoming more common in the Eastern U.S.
Why does NOAA use a threshold of $1 billion?
Even though $1 billion is an arbitrary threshold, these specific events account for the majority (>80%) of the damage from all recorded U.S. weather and climate events (NCEI; Munich Re). In fact, these billion-dollar disaster events are becoming an increasingly larger percentage of the cumulative damage from the full distribution of weather-related events at all scales and loss levels.
How do you calculate a disaster’s price tag?
We begin with high-quality and comprehensive public and private data sources including:
- Insurance Services Office
- Federal Emergency Management Agency
- U.S. Department of Agriculture
- National Interagency Fire Center
- Energy Information Administration
- U.S. Army Corps
- State agencies, and others
Each of these data sources provides key pieces of information that capture the total, direct costs—both insured and uninsured—of weather and climate events. These costs include:
- Physical damage to residential, commercial, and government or municipal buildings
- Material assets within a building
- Time element losses like business interruption
- Vehicles and boats
- Offshore energy platforms
- Public infrastructure like roads, bridges, and buildings
- Agricultural assets like crops, livestock, and timber
- Disaster restoration and wildfire suppression costs
One of the key transformations is scaling up insured loss data to account for uninsured and underinsured losses, which differs by peril, geography, and asset class. However, these loss assessments do not take into account losses to natural capital, physical or mental healthcare-related losses, or indirect costs such as losses within economic supply chains. Therefore, our estimates should be considered conservative with respect to what is truly lost, but cannot be completely measured.
The scale and complexity of a disaster greatly influence the length of time to assess the losses. Hurricanes are particularly challenging because it takes time to better understand the wind versus water damage losses across a variety of assets (like homes, businesses, boats and vehicles, infrastructure, and agriculture) and how much of this damage is insured versus uninsured. In contrast, with more localized events—like a Colorado hail storm—where property is highly insured, we can more quickly capture the losses.
Has every U.S. state experienced a billion-dollar disaster?
Yes, every state in the country has been impacted by at least one billion-dollar disaster since 1980. In fact, there have been more than 100 of these events that have affected at least some part of Texas, while only one event has impacted Hawaii (Hurricane Iniki in 1992). The Central, South, and Southeast regions typically experience a higher frequency and diversity of billion-dollar disasters than other regions of the U.S.
---
More about our expert
In addition to his role at NCEI, Adam Smith is also a member of the American Meteorological Society’s Committee on Weather/Climate Financial Risk Management, as well as a member of the National Institute of Standards and Technology’s National Windstorm Impact Reduction Program. He also serves as an expert for the World Meteorological Organization’s Cataloguing Hazardous Events team.