

NOAA's fleet of Earth-observing satellites provide a steady stream of data on environmental conditions that scientists can use to monitor the planet's ecosystems. This article provides a few examples of the kind of information that these satellites collect and how it's being used to keep tabs on everything from aerosols to snowpacks.
Beyond collecting data used in the weather forecasts millions rely on every day, the ever-watchful "eyes" of NOAA satellites also enhance the scientific community's ability to monitor ecosystems and track the effects of environmental change.For example, as it circles the globe from 520 miles above the surface of the Earth, the NOAA/NASA Suomi NPP satellite can capture data used to produce images like this one of the Inner Niger Delta, a complex combination of river channels, lakes, and swamps that provides both habitat for wildlife but resources for the local population. Over time, scientists can use the collection of images from the satellite's daily passes to assess different attributes of the area, such as the amount and health of its vegetation, the presence of drought, and more.To learn more about the myriad ways satellites can help scientists keep tabs on a variety of factors linked to the health of the planet, scroll down!
Taking the Temperature of the Great Lakes
According to data from NOAA Coastwatch's Great Lakes Environmental Research Laboratory, the temperatures of the Great Lakes in November 2016 were the warmest they've been since at least 2010 for this late in the month. Created with data from several satellites, this animation compares Great Lakes surface temperatures in 2014 with 2016. As you can see, the surface temperatures in November 2016 are several degrees warmer than those of this time two years ago.The last time that the Great Lakes were this warm was November 2010. That year, the lake surfaces remained mostly ice-free for the entire winter. As weather watchers and residents of the Great Lakes region know, the combination of warm lake waters and cold winter winds is a perfect combination for lake effect snow.
For the latest data on Great Lakes Temperatures, visit the website of the Great Lakes Environmental Research Laboratory.
Spying on Snow Packs
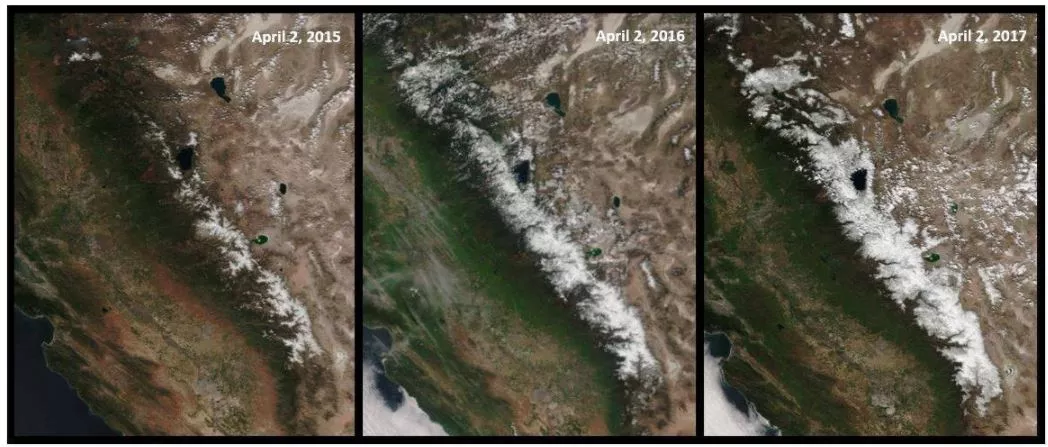
California's Department of Water Resources has reported -- and the following series of true-color images from the NOAA/NASA Suomi NPP satellite confirm -- that the snowpack in the Sierra mountains is significantly larger than it has been in the past two years.
According to department statistics, as of April 2, 2017, the snowpack's "snow water equivalent" (SWE) is 162 percent of the April 1 average, as compared to 84 percent of normal for the same date in 2016, and 5 percent of normal for the same date in 2015. (The start of April has traditionally been seen as the end of California’s rainy season, so the April 1 snowpack is the standard by which the extent of each year’s winter is measured.)
See what the snowpack looks like now in NOAA View.
Watching Floodwaters
This pair of false-color images from the Visible Infrared Imaging Radiometer Suite (VIIRS) instrument aboard the NOAA/NASA Suomi NPP satellite shows the extent of the flooding in eastern North Carolina caused by Hurricane Matthew.The "before" image on the left shows water levels in the area on September 24, 2016, and the "after" image on the right shows swollen rivers and streams in the region on October 11, 2016.On October 13, 2016, the National Weather Service issued a flood warning for eastern North Carolina noting that, "The State Department of Transportation [has] reported numerous flooded roads as rivers continue to experience major flooding. Many roads are impassable, barricaded, or washed away. Some neighborhoods are cut off. Some swamps, creeks, and rivers are still rising, flooding even more areas and slowing the recession of high waters."
For more information on flooding in North Carolina after Hurricane Matthew , visit the website of NOAA's Environmental Visualization Lab.

Assessing Aerosols
This true-color image (left) and map of aerosol optical thickness data (right) from the Visible Infrared Imaging Radiometer Suite (VIIRS) instrument aboard the NOAA/NASA Suomi NPP satellite show a large plume of smoke over Northwest India on October 29, 2016.In addition to generating images in true color, which is created with data from three of its 22 channels, VIIRS can also detect areas of the atmosphere in which aerosols (a catch-all term that refers to mixtures of gases and fine particles in the air) are absorbing or scattering sunlight. In this map, the areas of deep orange denote thick aerosol layers and correspond well with the areas covered by smoke in the true-color image. Areas of low aerosol optical thickness are colored light yellow.
More information on aerosols can be found in NOAA View.
Observing Ocean Nutrients
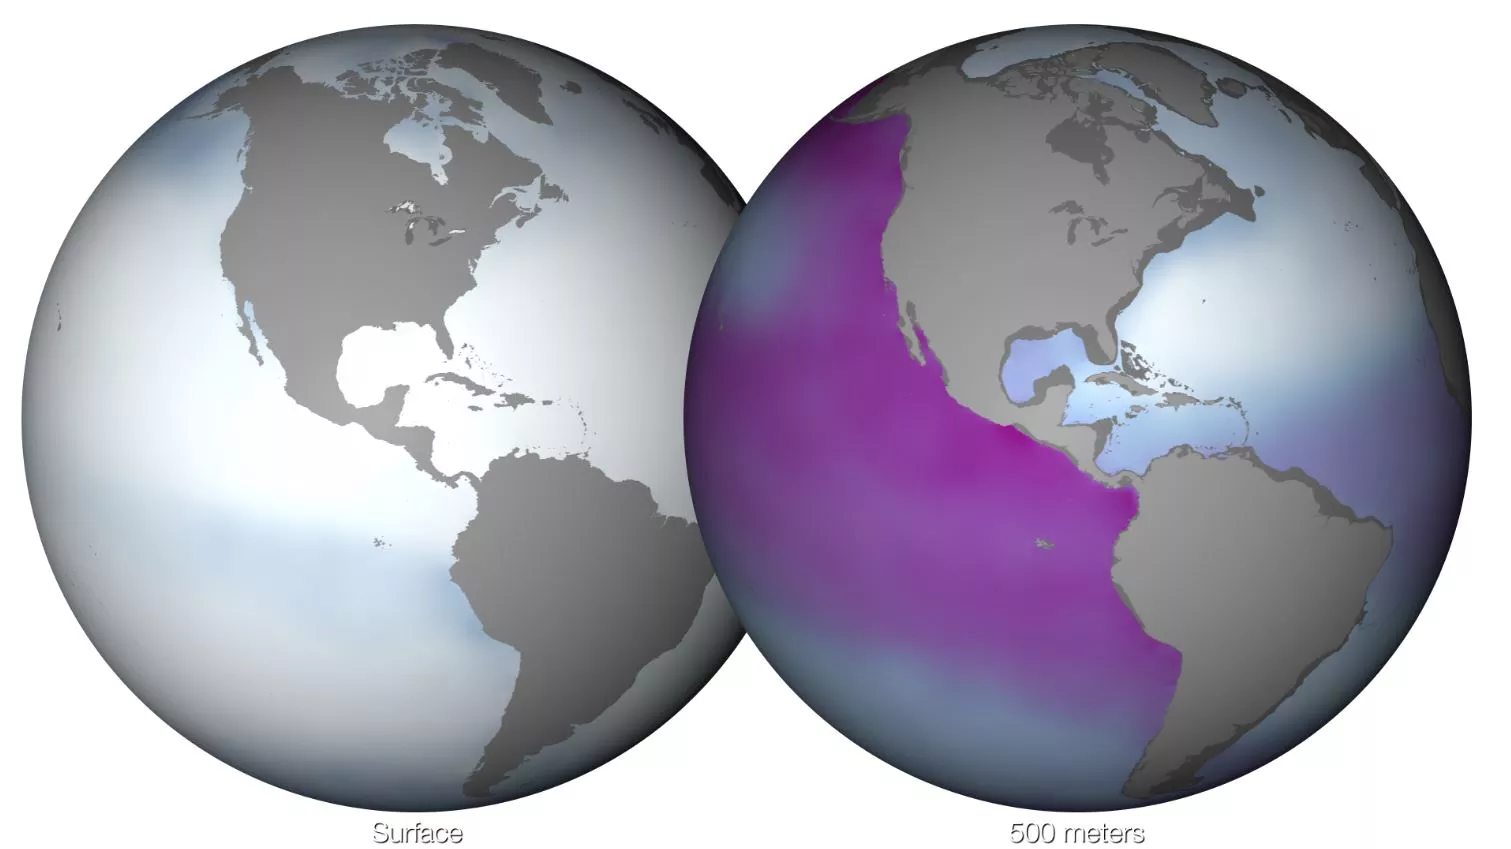
Though teeming with life, the surface waters of the ocean can be quickly depleted of nutrients courtesy of plankton and other marine life. Fortunately, the world's oceans experience a process known as up-welling, when deep waters circulate to the surface and replenish nutrients such as phosphate, nitrate, silicate and dissolved oxygen.Shown here are maps of dissolved phosphate at the surface and at a depth of 500 meters. These maps illustrate the stark differences in phosphate availability in different layers of the ocean. Areas with strong up-welling, such as the west coast of North and South America, typically support greater abundances of phytoplankton, since deep reserves of nutrients are brought to the surface. In addition, colder surface waters hold more dissolved nutrients than more temperate waters.
To see more maps of ocean chemistry , such as salinity, visit NOAA View.