
This week marks the tenth anniversary of one of the largest, deadliest, and most destructive tornado outbreaks in United States history.
The Outbreak
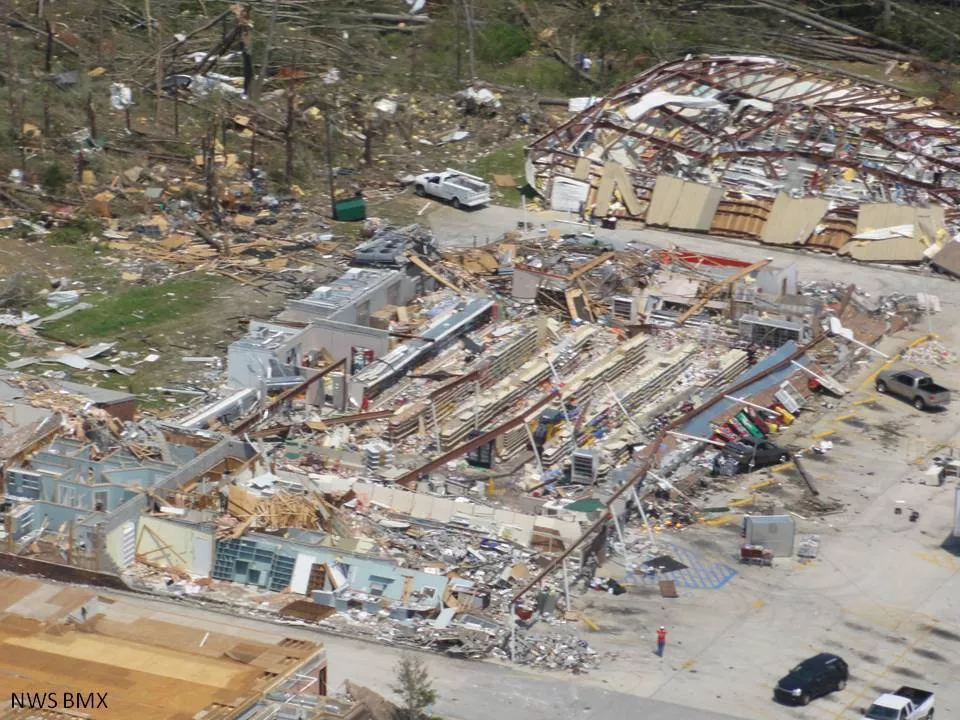
The ingredients for this now-infamous tornado outbreak started coming together the weekend before. A powerful low-pressure system was sweeping across the U.S. and it was expected to combine with moist and unstable air as it pushed eastward that Monday, April 25. During the next four days, more than 360 tornadoes touched down from Texas to New York. Of those, there were three EF5 tornadoes—with winds above 200 mph—12 EF4 tornadoes and 21 EF3s.
The outbreak from April 25-28, 2011, challenged and surpassed the records set by almost all previous tornado events, ranking as one of the deadliest and most expensive meteorological disasters on record. It resulted in roughly $12 billion in damages and left an estimated 321 people dead. The event killed more people than any tornado outbreak since 1936, when 454 people lost their lives.
GOES-13
During that outbreak a decade ago, NOAA’s GOES-13 satellite served as GOES East, and it was a critical source of information during major U.S. weather events. When GOES-13 first launched from Cape Canaveral Air Force Station in May 2006, it joined a new generation of satellites known as the GOES-N,O,P series. With faster data processing, GOES-13 could pinpoint the location of severe storms and other weather phenomena with increased accuracy, allowing forecasters to provide timelier warnings to the public.
Below is more satellite imagery from the April 2011 Super Outbreak. For more information about that historic outbreak, click here.
Today’s GOES Satellites
Ten years later, NOAA has another generation of geostationary satellites called the GOES-R series, with GOES-16 and GOES-17 serving as GOES East and West, respectively. The GOES-R Series scans the Earth five times faster with four times the resolution and three times the number of channels than previous GOES satellites. The satellites’ Advanced Baseline Image ABI provides images as frequently as every 30 seconds for more accurate and reliable forecasts and severe weather warnings.
Working in concert, NOAA’s GOES-R satellites provide constant watch over the United States and the Western Hemisphere, helping monitor severe storms, tropical systems, wildfires, and daily weather patterns.
---
Special thanks to UW-Madison CIMSS, NASA Earth Observatory, and NOAA NWS Birmingham for some of the imagery above