
August 19th marks National Aviation Day, a United States national observation originally established in 1939 by President Franklin Delano Roosevelt in honor of Orville Wright’s birthday. Orville and his brother Wilbur are credited with inventing and building the world's first successful airplane and making the first controlled, powered and sustained heavier-than-air human flight, on December 17, 1903. To prepare for their historic flight, the Wrights contacted the U.S. Weather Bureau, the precursor to NOAA's National Weather Service (NWS), seeking information on locations with sufficient wind conditions to suit their needs.
The U.S. Weather Bureau created the first official aviation weather forecast for the Aerial Mail Service route from New York to Chicago on December. 1, 1918. In the early years of forecasting, meteorologists used basic tools like kites and balloons flown with instruments attached to forecast temperature and wind direction to create aviation forecasts. NOAA’s NWS now uses advanced satellite data to support all aspects of flight, from planning, takeoff and departure, en route, and through arrival and landing.

NOAA’s polar orbiting environmental satellites (POES) and geostationary operational environmental satellites (GOES) weather satellites, like the Joint Polar Satellite System (JPSS) and Geostationary Operational Environmental Satellites – R Series (GOES-R), will provide vital observations of issues such as turbulence, icing, thunderstorms, and low ceilings and visibility as inputs to NWS aviation weather analyses and forecasts. Airline delays in the National Airspace System due to these weather issues have steadily decreased over the last five years but still constitute the majority of all delays with over 192,000 weather delays occurring last year. The data from NOAA weather satellites are used to create products for specific conditions and locations to predict and monitor dangerous weather conditions.
Observing Alaska
In Alaska, JPSS provides critical data for nearly all of the weather forecasting for aviation, filling gaps over areas that are not adequately covered by conventional observing systems. Aviation touches all aspects of life in Alaska, and is a basic mode of transportation because approximately 90% of Alaska is not served by roads. Alaska has six times as many pilots per capita and 16 times as many aircraft per capita when compared to the rest of the United Statesi.
The north Pacific air routes connecting Alaska to the Far East carry 10,000 people per day and up to 50,000 aircrafts per year.
Polar-orbiting satellite products enable forecasters at NOAA’s Alaska Aviation Weather Unit to provide critical aviation forecasts and more effective aviation warning support. Alaska’s high latitude location ensures that it receives data from multiple polar-orbiting passes every day, helping this critical data offset the lack of ground-based and radar observations. Aviation in Alaska is impacted by everything from low cloud and fog, icing, turbulence, extremely cold temperatures, and volcanic ash. The Suomi-NPP satellite, with its advanced imager and sounder products, has proven to be a vital information source for Alaskan aviation forecasters.
Monitoring Volcanoes and Volcanic Ash
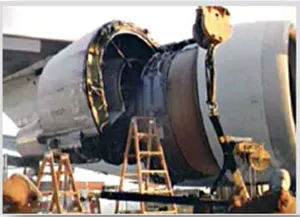
Only 10 percent of the world's volcanoes are routinely monitored from the ground, making satellites the only frequently available tool that can reliably identify volcanic eruptions anywhere in the world. Advanced analysis of data from polar orbiting and geostationary satellites reduces the probability of a disastrous and/or costly aircraft encounter with volcanic ash and helps to minimize the cost associated with avoiding volcanic ash. Volcanic ash is extremely harmful to jet engines, and can melt and congeal within turbines and other parts, causing rapid engine failure. For this reason it is vital that the height and extent of volcanic ash be accurately forecast. Tools from new, high-resolution satellite instruments like those on GOES-R and JPSS will help make this possible.
Volcanic ash is often spread far beyond the erupting volcano, leading to airline delays and cancellations. In 2010 the Eyjafjallajökull volcano in Iceland erupted, causing a six-day travel ban over the controlled airspace of many European countries. The data given to the air traffic control organizations provided the information they needed to make the decision to divert and ground more than 4,000 flights. The ban was in effect to address the possibility of volcanic ash ejection causing damage to aircraft engines and risking human life. This was the largest air-traffic shutdown since World War II, costing $1.7 billion in losses for the airline industry, as well as innumerable losses within freight imports and exports; tourism industries and the access to fresh food and essential goods.
Data from NOAA satellites are used to create volcanic ask detection and property products for the Volcanic Ash Advisory Centers (VAAC). The VAAC advisory data is given to the air traffic control organizations to determine when it is necessary to divert and ground flights. For example, data from the Ozone Mapping and Profiler Suite (OMPS) onboard the Suomi-NPP satellite is used to track and monitor volcanic emissions that may impact aviation. Researchers at the University of Wisconsin-Madison Space Science and Engineering Center, Cooperative Institute for Meteorological Satellite Studies have designed a series of operational products utilizing satellite data that derive the height and particle size of volcanic ash, while also accurately showing its spread.
Capturing Fog Conditions

Fog conditions occur when clouds begin within 50 feet of the surface which impacts visibility and can affect a pilot’s ability to take off or land safely, causing delays and lost revenue. Data from polar-orbiting and geostationary satellites data are combined with models and used to create a joint Fog and Low Stratus (cloud) product to provide a probability of Instrument Flight Rule (IFR) conditions. IFR conditions are regulations established by the Federal Aviation Administration (FAA) to govern flight conditions in which flight by outside visual reference is not safe.
The Fog and Low Stratus product proved effective early in the morning of June 18th, 2013, where it showed IFR probabilities greater than 80% over Lake Michigan and moving southwest towards Chicago airspace.
A National Aviation Meteorologist was monitoring Fog and Low Stratus product and noticed low ceilings would begin to impact the airspace around the Chicago Midway International and Chicago O’Hare International Airports. These conditions were not reflected in other forecasts which showed clear skies. The National Aviation Meteorologist shared the critical information from the Fog and Low Stratus product with the FAA.
Using the new information, the FAA, airports and airlines were able to create a new plan of action for air traffic. This information allowed the airlines to stagger plane arrival windows and increase the amount of fuel onboard, to allow for extra holding time to avoid causing planes to divert and waste more fuel. Roughly 60 flights were able to land under these conditions without diversions, saving around $600,000.
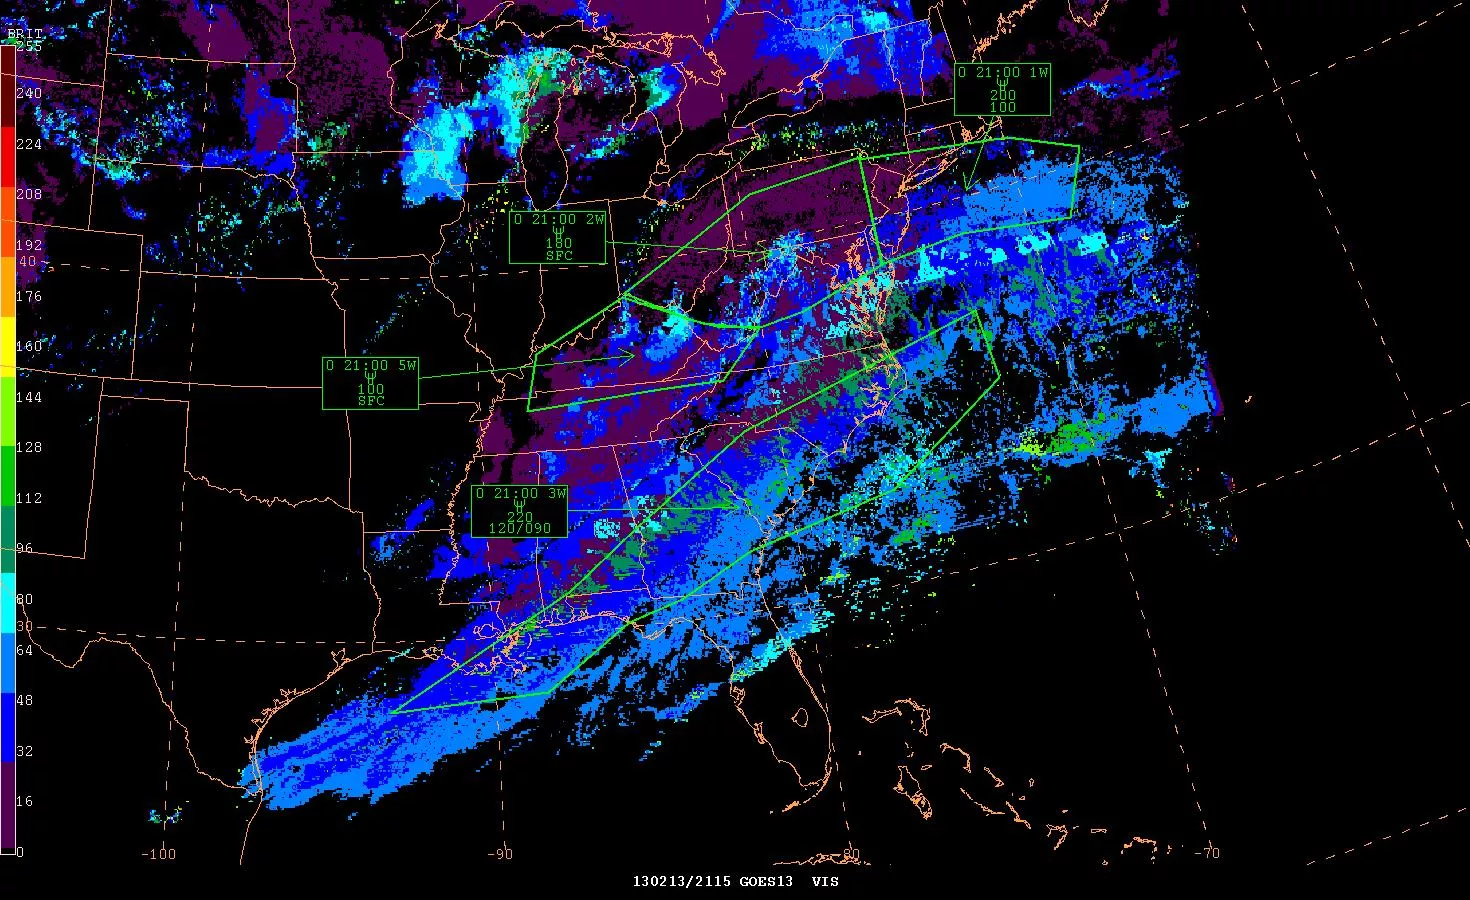
Predicting Thunderstorms

During the summer months thunderstorms affect air travel the mostii. When air traffic managers are dealing with thunderstorms impacting airspace, one of the most important things that they consider is where the top of these storms are located. Currently they rely on tools like a radar echo tops algorithm, which determines the top of the precipitation within the core of a thunderstorm). However, this is difficult in radar sparse areas and areas with few observations (i.e. over large bodies of water) where the satellite derived cloud altitudes or tops become very useful. Using cloud property retrievals from geostationary satellite data, the algorithm estimates the top of the convective cloud and is not hampered by the same radar and observation limitations, helping to predict and monitor dangerous storms.
Calculating Dust Storm
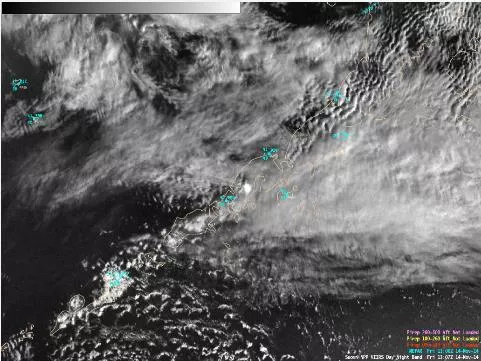
While blowing dust events are not a frequent occurrence over the U.S., they can cause significant impact to aviation. Dust reduces visibilities just as much as a snowstorm, but while snow is easy to identify on radar, dust is not. It is even more difficult to detect using generic satellite imagery. However, high-resolution satellite imagery from JPSS has changed this.
Using visible and infrared bands from the Visible Infrared Imaging Radiometer Suite (VIIRS) instrument, researchers from the Cooperative Institute for Research in the Atmosphere (CIRA) developed an algorithm to differentiate between cloud and dust, and enhance the latter. In April of 2014, a weekend-long dust event occurred over eastern Colorado and northern Texas. With a strong low pressure system moving across the center of the country and winds in excess of 70 mph, coupled with an ongoing drought, dust was immediately lofted. However, given existing cloud cover and the fine particles of the dust, it was extremely difficult to see on satellite imagery. Subsequently it was very difficult for aviation forecasters to issue advisories for the blowing dust. Using the CIRA algorithm they were able to take a look at the dust enhancement and easily determine the location of the dust, confirming the location to issue the advisory and adjust accordingly.
Forecasting Icing Conditions
Icing conditions can also be very treacherous to aircrafts. Satellite data provides vital information to the forecasting process for finding icing conditions. In assessing current icing conditions, visible and infrared satellite imagery provides an excellent overall picture of what to expect. Cloud parameters derived from geostationary satellite data help to better define the potential icing threat to aircraft and improve icing forecasts.
When an aircraft encounters icing in flight it is important that pilots know how thick that the cloud layer producing the icing is. When ice begins to build up, pilots need to know how high or low they must descend to escape it, or how far they need to divert to fly out of and around it. An experimental product, using geostationary satellite data, and soon JPSS data, to estimate the tops and bases of the icing layer has the potential to provide valuable information to forecasters at the NWS Aviation Weather Center. This will allow forecasters to more accurately predict tops and bases in their products.
Looking to the Future
As the nation’s aviation system continues to grow, and a greater number of people are expected to fly more miles each year, accurate and timely aviation forecasts are critical. NOAA’s satellite data continues to provide vital observations of unfavorable weather issues protecting life and property and helping to secure a more “Weather-Ready Nation.” NOAA satellites represent significant technological and scientific advances in environmental monitoring and will help advance weather, climate, environmental and oceanographic forecasting and monitoring with greater accuracy.