
As expected, the Larsen C ice shelf calved a large iceberg estimated to have a volume twice that of Lake Erie.
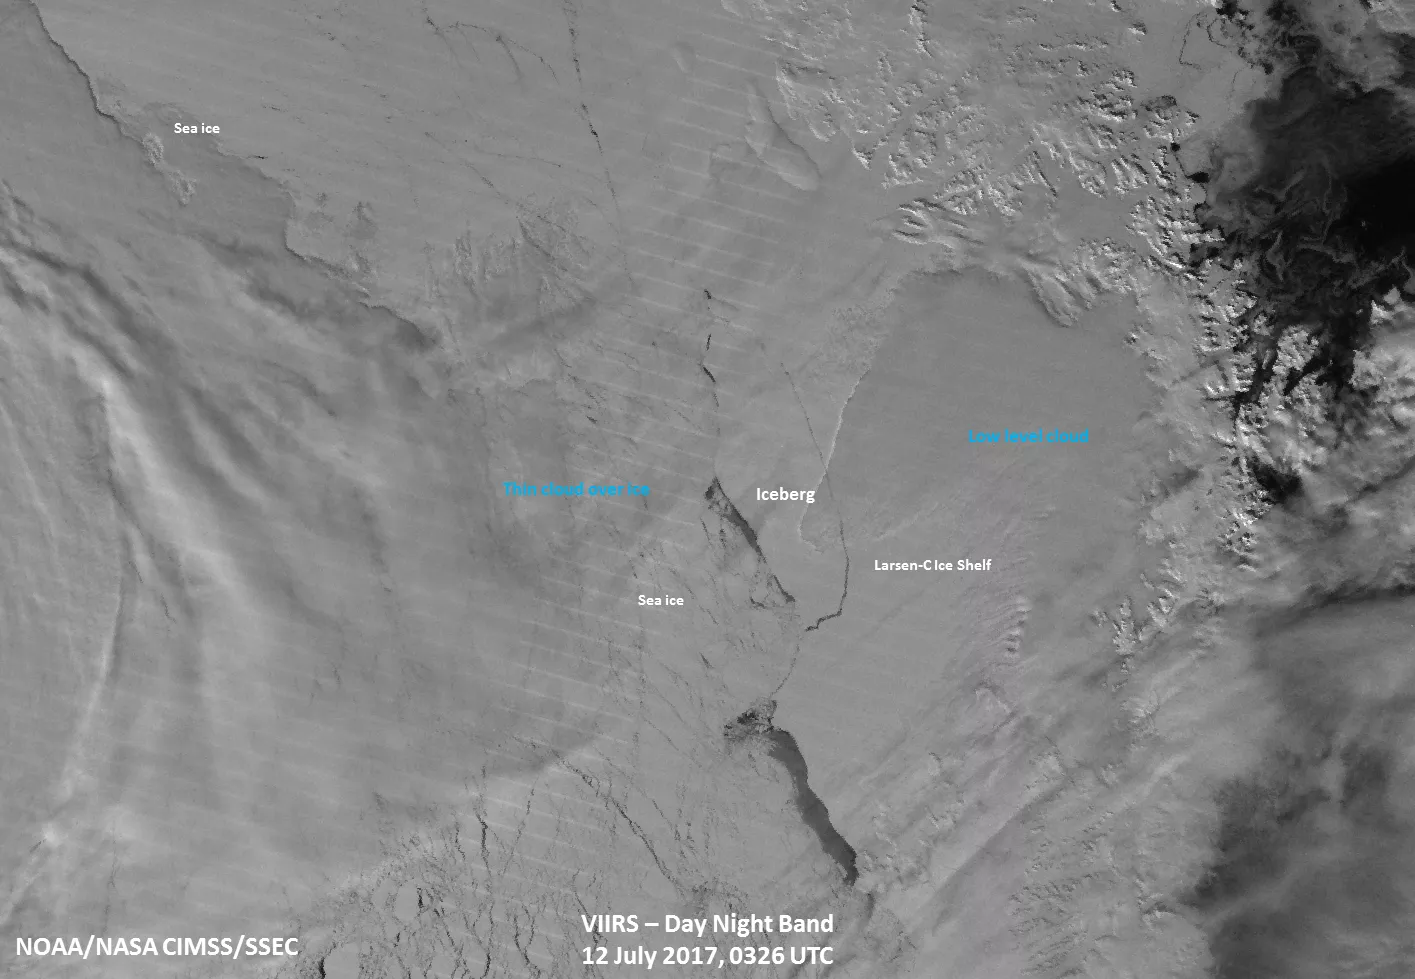
The Visible Infrared Imaging Radiometer Suite (VIIRS) aboard the NOAA/NASA Suomi NPP satellite captured these Day-Night Band (top) and I-05 longwave infrared band (below) images of the Larsen C ice shelf, which calved an immense iceberg sometime between July 10 and the morning of July 12, 2017.Scientists from Project Midas, a UK-based Antarctic research project, estimate that the iceberg is approximately 2,240 square miles (5,800 square kilometers) -- more than three times the size of the greater London-area -- weighs more than 1-trillion tons and has a volume that is twice that of Lake Erie.
Ice shelves fringe 75 percent of the Antarctic ice sheet and the Larsen C ice shelf, located on the east side of the Antarctic Peninsula, is the fourth largest ice shelf ringing Earth’s southernmost continent. The first available images of Larsen C are airborne photographs from the 1960s and an image from a U.S. satellite taken in 1963. The rift that has produced the new iceberg was already identifiable in those pictures, along with a dozen other fractures. The crack remained dormant for decades, but in 2014, it started to grow rapidly.VIIRS's Day-Night Band (DNB) is sensitive enough to detect the low levels of visible light at night. In doing so, the DNB allows the satellite to "see" at night using the reflection of moonlight and ambient nightglow -- a mix of light coming from auroras, starlight, zodiacal light (sunlight scattered across the solar system by dust particles in space), anthropogenic light and a variety of other sources. This is significant because most visible-wavelength sensors don’t work at night since the sources of light on the Earth's surface are too weak to be detected. Prior to the launch of Suomi NPP, only the DMSP satellites, which carried Operational Linescan System instruments, were able to capture visible imagery at night.
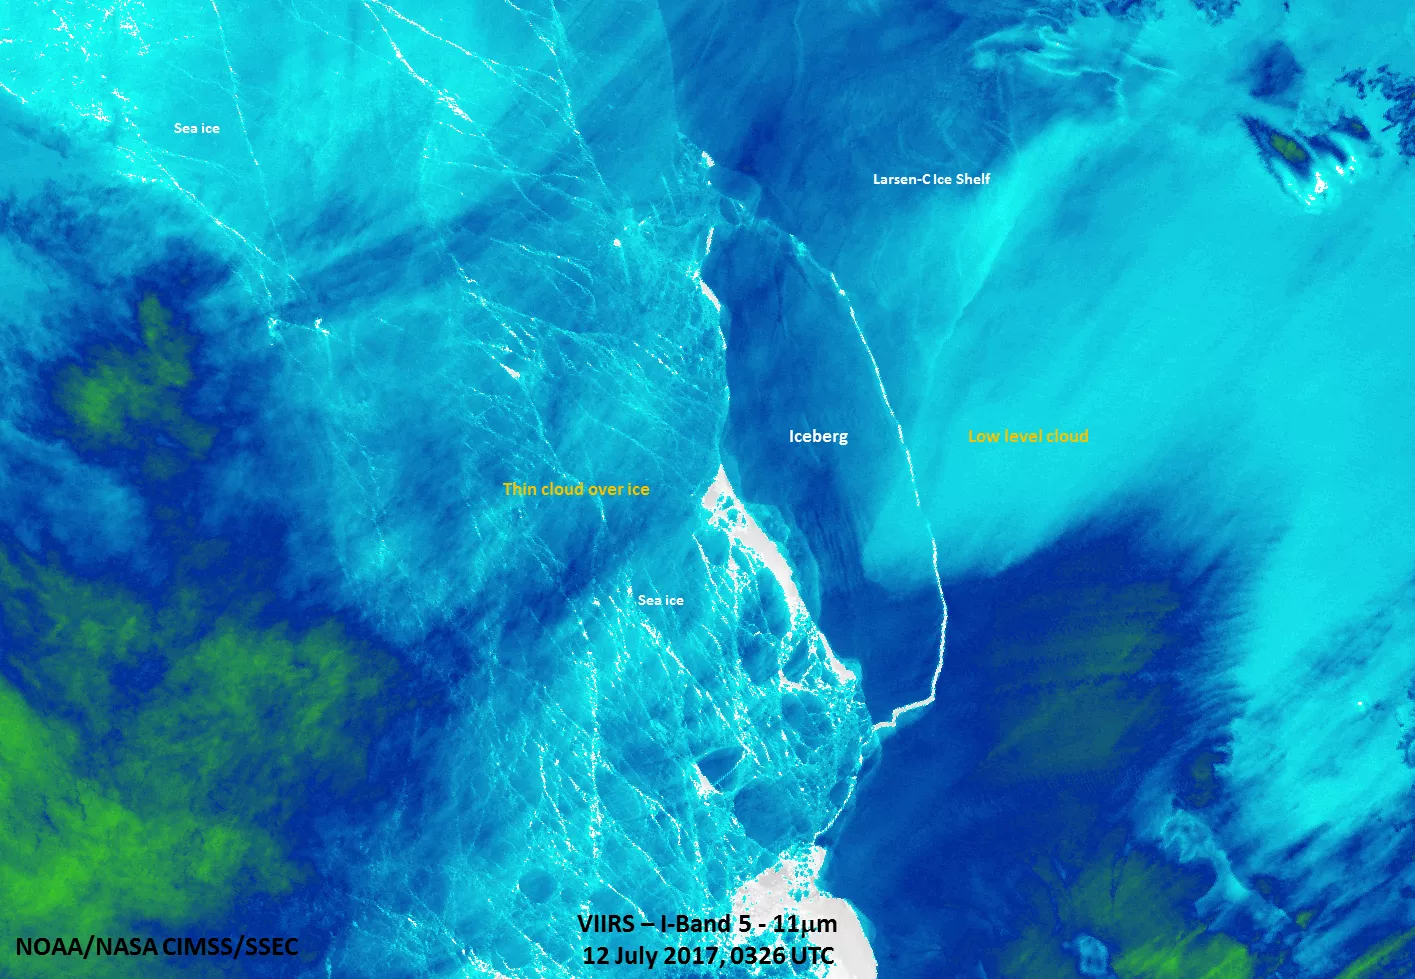
On the contrary, the I-05 longwave infrared band is, typically used as sort of an "all-purpose" channel for cloud detection, both during the day and at night. The band can provide an estimate of cloud height, provide information on surface temperature patterns, and can be used to detect so-called overshooting cloud tops in severe weather and areas of convection (for example, where a cluster of thunderstorms is around a tropical system). In addition, data from this band can be used in conjunction with data from other channels to determine sea ice concentration.
The polar-orbiting Suomi NPP circles the globe from pole to pole 14 times daily in the afternoon orbit—providing full coverage of the Earth twice a day. In doing so, the spacecraft gathers global measurements of atmospheric, terrestrial and oceanic conditions—including atmospheric temperature and moisture, hurricane intensity, clouds, rainfall, dense fog, volcanic ash, fire locations, smoke plumes, sea and land surface temperatures, vegetation, and as seen here, snow and ice cover.
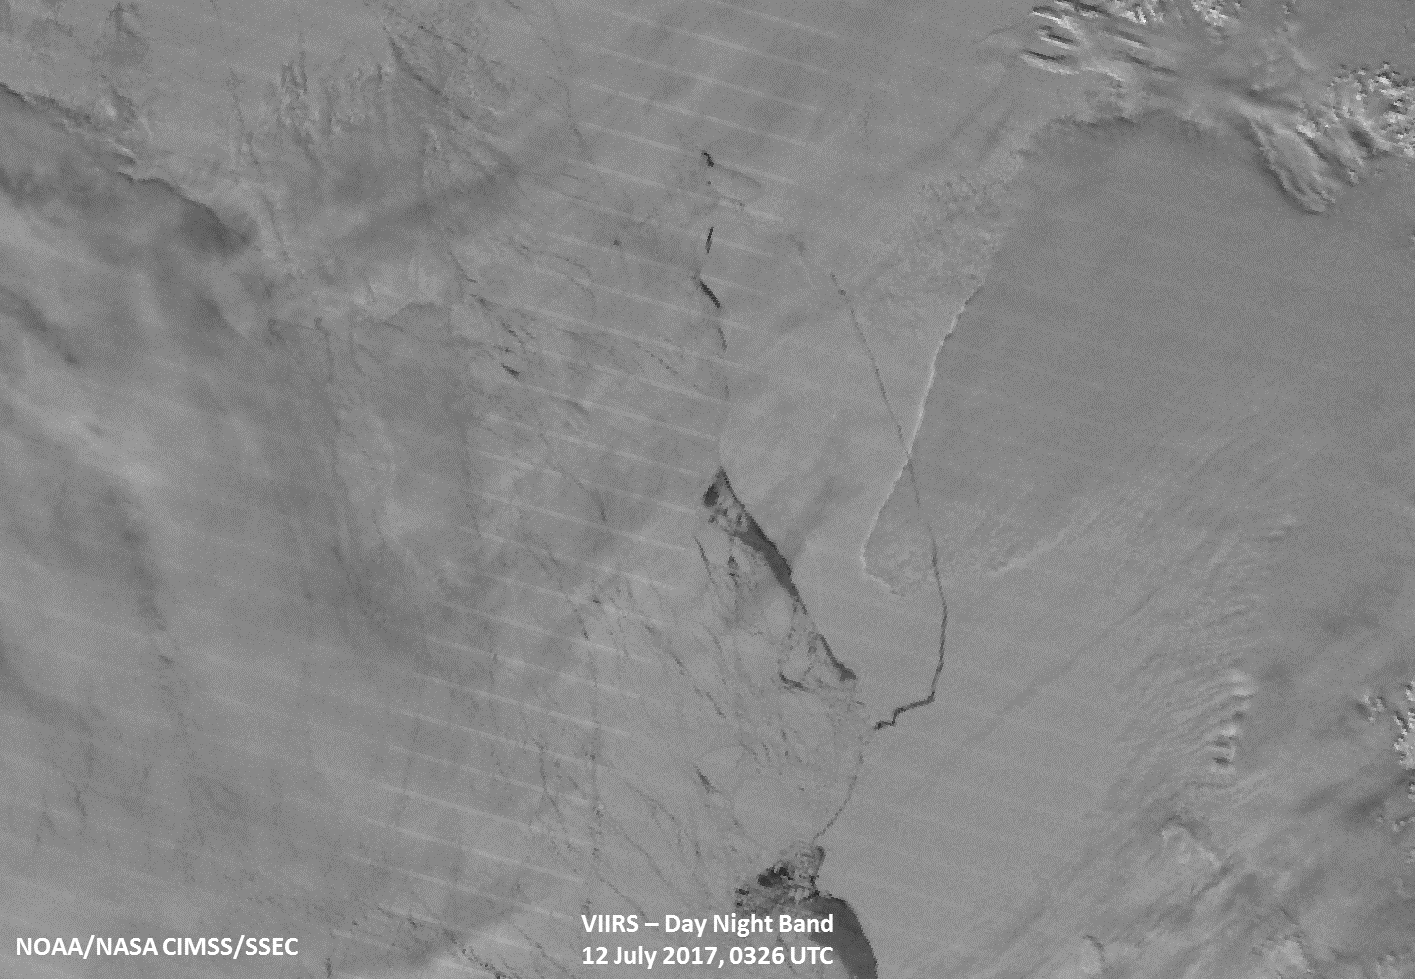
The Visible Infrared Imaging Radiometer Suite (VIIRS) aboard the NOAA/NASA Suomi NPP satellite captured this Day-Night Band animation of the Antarctic peninsula showing the large iceberg -- now known as the A-68 iceberg -- that broke off from the Larsen C ice shelf. Of note in this loop is that the iceberg appears to be drifting to the south, expanding the lead on the north side.