
Hurricane Andrew was the strongest and most devastating hurricane on record to hit southern Florida. When it made landfall, Andrew was a Category 5 hurricane, with maximum sustained winds of 165 mph and a minimum central pressure of 922 millibars. It’s one of only four hurricanes to make landfall in the United States as a Category 5 since 1900 (the others being the 1935 Florida Keys Labor Day storm, Hurricane Camille in 1969, and Hurricane Michael in 2018).
It struck South Miami-Dade County (then known as Dade County) during the pre-dawn hours on Monday, August 24, 1992. It caused an estimated $26 billion in damage in the United States making it at the time the most expensive natural disaster in United States history, not to be surpassed until Hurricane Katrina 13 years later. In Homestead, Florida—the hardest hit community—more than 99% of the mobile homes were completely destroyed.
After leaving Florida, Andrew moved into the Gulf of Mexico and made a second landfall near Point Chevreuil, Louisiana, on August 26, 1992, as a Category 3 hurricane with winds of 115 mph and a central pressure of 956 millibars. The damage to Louisiana was estimated at around $1 billion. By the time it finally dissipated, Andrew was responsible for 23 direct deaths in the United States.
Below is some imagery from Hurricane Andrew as seen from NOAA satellites in 1992:
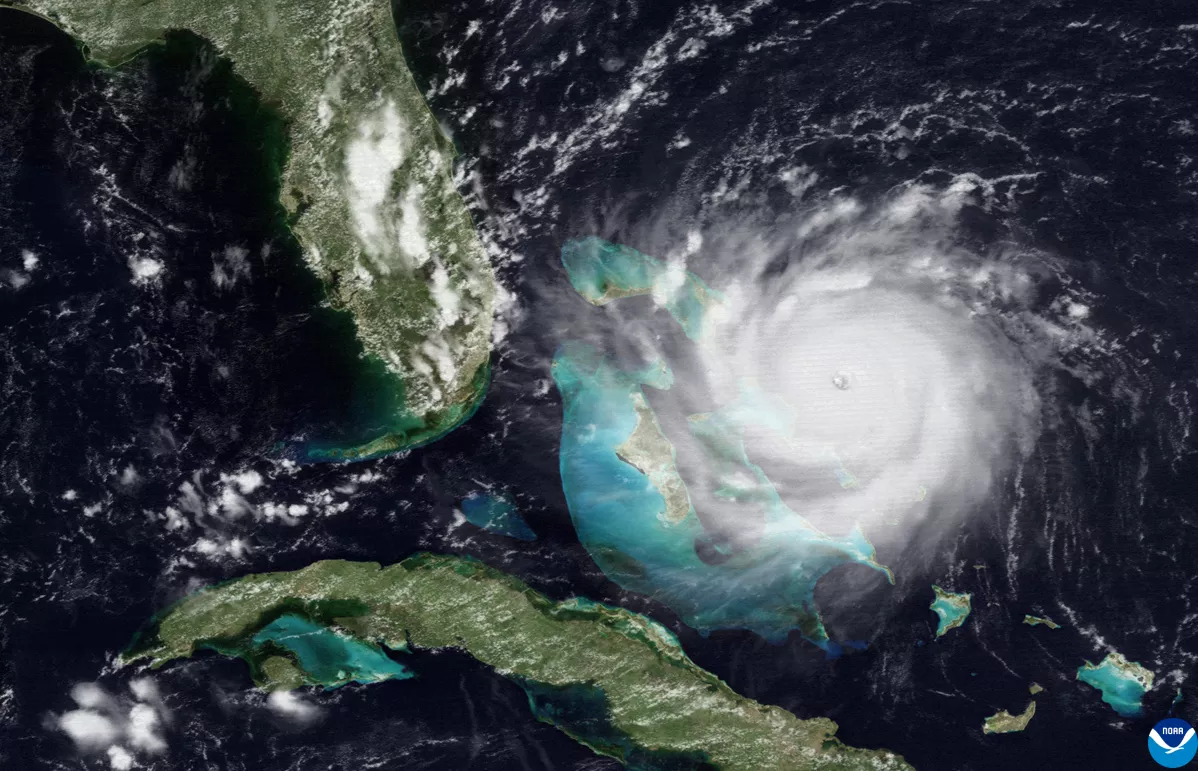
Visible image from NOAA’s GOES-7 satellite of Hurricane Andrew approaching South Florida on August 23, 1992.

Color-enhanced infrared image from the NOAA-11 satellite of Hurricane Andrew east of South Florida at 8:31 am EDT on August 23, 1992.
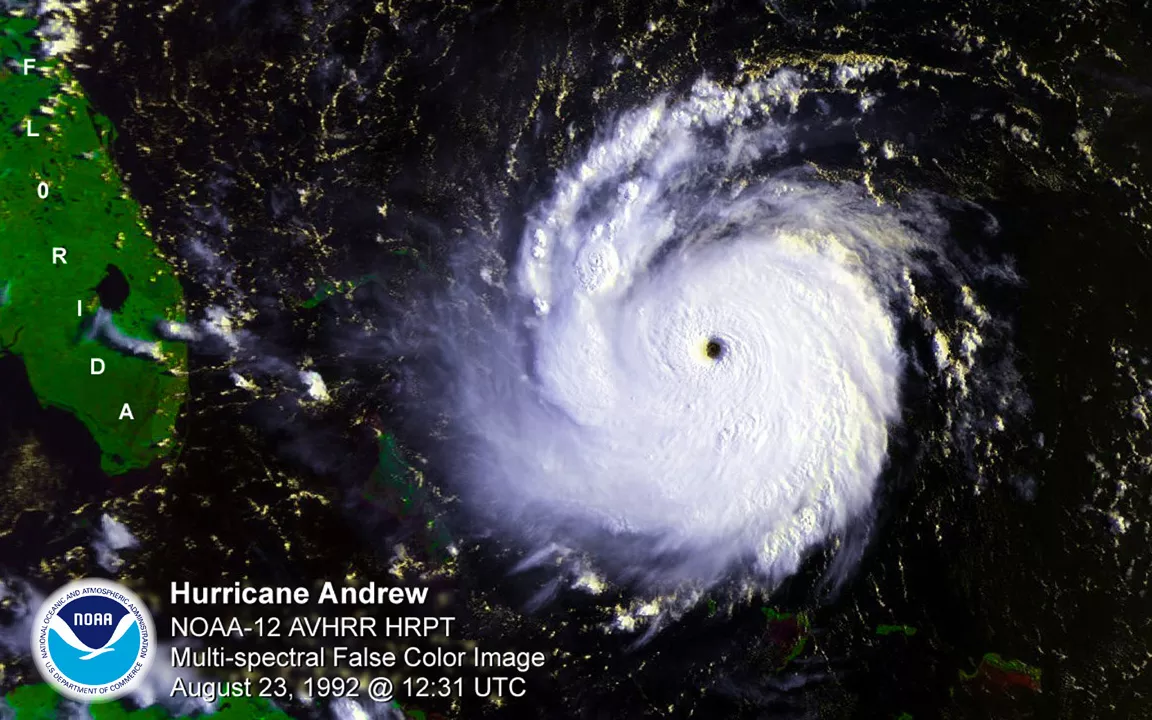
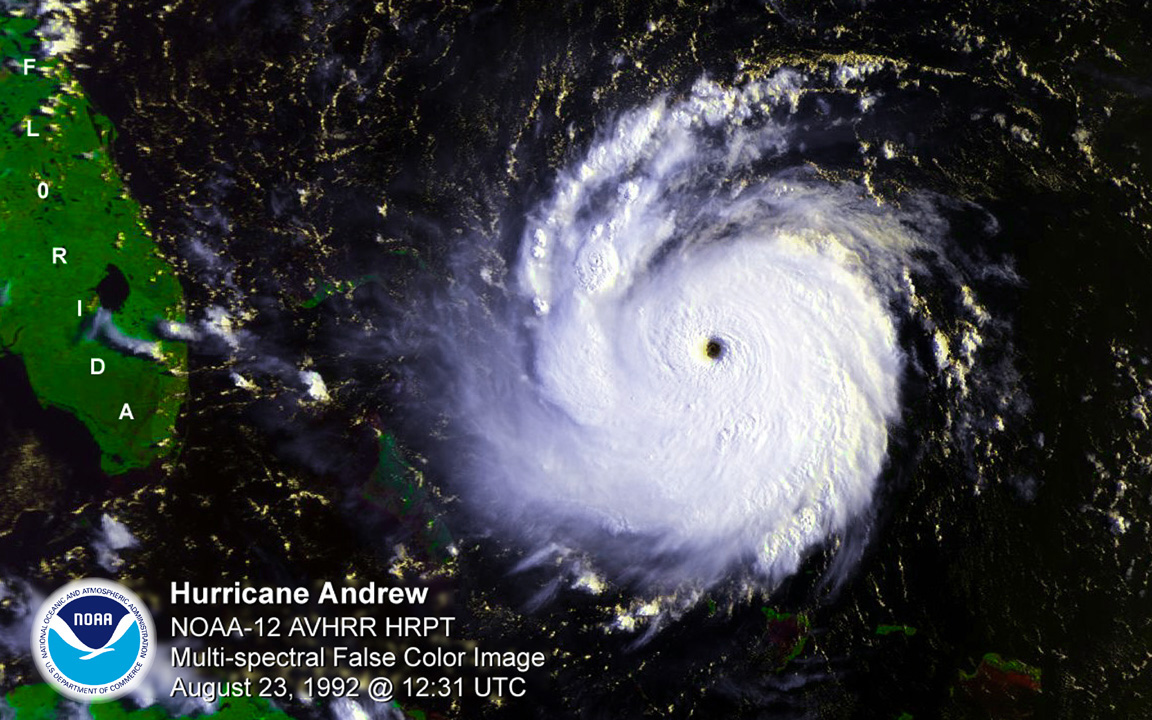
Color-enhanced multi-spectral image from the NOAA-12 polar-orbiting satellite of Hurricane Andrew approaching South Florida at 8:31 am EDT on August 23, 1992.

Color-enhanced infrared image from NOAA’s GOES-7 satellite of Hurricane Andrew crossing South Florida at 6:01 am EDT on August 24, 1992.

2km-resolution visible image from NOAA’s GOES-7 satellite of Hurricane Andrew at 12:01 EDT on August 24, 1992, after the storm crossed South Florida.
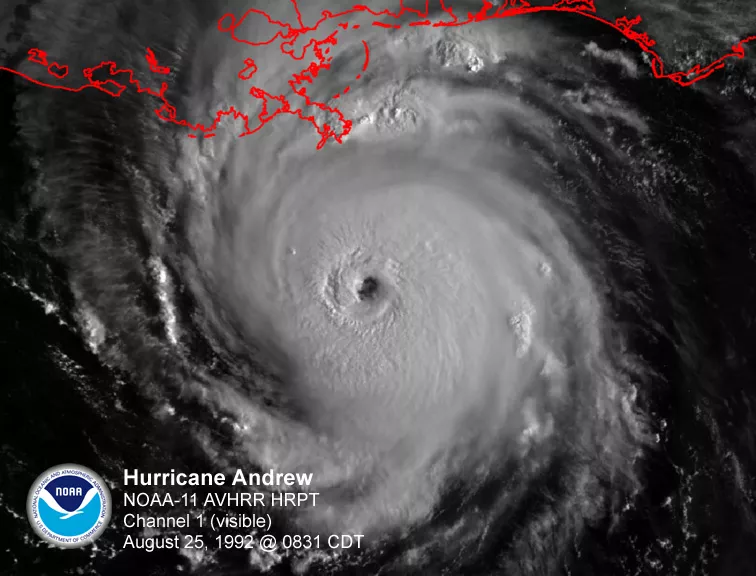
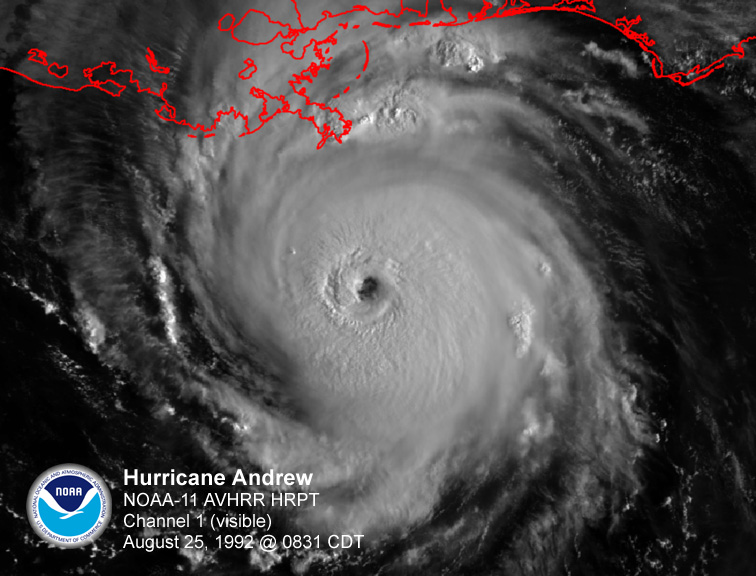
Visible image from the NOAA-11 polar-orbiting satellite of Hurricane Andrew approaching Louisiana at 8:31 am CDT on August 25, 1992.
Color-enhanced infrared animation from NOAA’s GOES-7 satellite of Hurricane Andrew from August 22-24, 1992.
NOAA’s Latest Generation of Satellites
Thirty years later, NOAA’s latest generation of geostationary satellites has revolutionized the way scientists and forecasters monitor and track tropical systems.
“Weather satellites are a vital tool for monitoring hurricanes at all stages of development and intensity–from identifying storms and monitoring their structure to making forecasts and alerting the public,” said Jordan Gerth, Ph.D., weather observations scientist with the National Weather Service. “Decades after Hurricane Andrew, the latest generation of weather satellites has helped improve our predictions of tropical systems and boosted our confidence in storm track forecasts.”
NOAA’s Joint Polar Satellite Series (JPSS) satellites are the backbone of weather forecasting. More than 90% of the data flowing into weather prediction models comes from polar-orbiting satellites. Data from polar-orbiting satellites consist of accurate, high-resolution atmospheric temperature and water vapor information, which are critical inputs to forecast models that help predict the intensity and location of severe weather, including tropical systems, several days in advance.
According to one scientific study, the NOAA forecasts of Hurricane Sandy’s track could have been hundreds of miles off without information from polar-orbiting satellites. Rather than identifying the New Jersey landfall location within 30 miles five days before landfall, the models would have shown Sandy remaining at sea.
NOAA’s latest geostationary satellites, called the Geostationary Operational Environmental Satellite (GOES) -R Series, consists of three geostationary satellites currently in orbit—GOES- 16, -17, and -18—keeping a constant eye over the Western Hemisphere. A fourth and final GOES-R satellite is scheduled for launch in 2024.
Equipped with an Advanced Baseline Imager (ABI), the GOES-R satellites can monitor environmental conditions in high-resolution detail to help identify tropical storms as they’re developing. Once a hurricane forms, ABI can monitor the storm in near real-time, identifying cloud features and patterns, and providing crucial estimates of central pressure and maximum sustained winds.
The ABI’s improved spatial resolution (four times greater than previous GOES imagers) also helps forecasters better identify storm cloud patterns and analyze the intensity of a hurricane. ABI is able to scan a targeted area of interest as often as every 30 seconds, providing unprecedented monitoring of a storm from space. Faster image frequency allows forecasters to more easily discern the movement of cloud features and provide greater confidence in estimating the center of the storm and its wind speeds. The added confidence in locating the center of circulation also helps guide reconnaissance aircraft (“hurricane hunters”) to the correct location. Rapid-scan imagery of intense hurricanes just prior to or during landfall can improve the ability to observe quickly evolving changes in the storm’s intensity and convective structure during this critical part of the warning process.
ABI has additional channels not available from previous GOES. New infrared channels help forecasters better determine how cold cloud tops are and how rapidly they are cooling, which aids predictions for rainfall intensity and potential flash flooding associated with hurricane rain bands.
The Geostationary Lightning Mapper (GLM), the first operational lightning mapper flown in geostationary orbit, is a new capability that is enhancing the observation of lightning activity in hurricanes. Research has shown that lightning can correlate with hurricane intensity changes and GLM can help forecasters predict rapid intensification up to 24 hours ahead of time.
Below is an example of the imagery NOAA now receives from the GOES-R series satellites. Both animations are from Hurricane Ida, which came crashing ashore near Port Fourchon, Louisiana, on August 29, 2021.
Animation of visible imagery overlaid with GLM imagery of Hurricane Ida from NOAA’s GOES-16 satellite on August 29, 2021.
Animation of zoomed-in visible imagery from NOAA’s GOES-16 satellite of Hurricane Ida’s eye as it pushes inland across southern Louisiana on August 29, 2021.
Learn more about how NOAA’s latest GOES-R satellite series helps forecasters better monitor and forecast hurricanes and tropical storms, here.