
Mid-June in Utah usually marks the tail end of the most fertile time of year for crops. In a typical year, snowmelt in April and May wets the soil, resulting in a burst of blooming flowers and crop growth.
“Usually we have a beautiful, green landscape right now,” said Dr. Jon Meyer, a research climatologist with the Utah Climate Center. “It’s one of my favorite times of year because we get green for six weeks — and then we go back to brown for the rest of the year.”
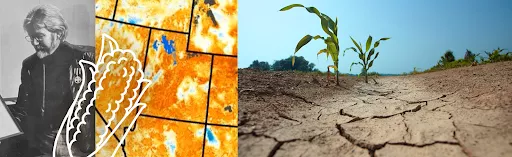
Not so this year. Drought has gripped the American West, and in Utah, more than 92 percent of the state meets the criteria for “extreme drought,” fueled by what Dr. Meyer described as “a deadly combination of record heat and record dry.” In a recent presentation on drought in the Southwest, Meyer showed a collection of grim indicators: high temperatures, little rainfall, low soil moisture, and finally, poor vegetative health.
This last indicator has become an important metric for climate scientists and meteorologists trying to understand how weather and temperature impact the health of crops, and as an extension, food security, food prices and the global agricultural market.
Tracking Crop Health
This week in the U.S., 216 million acres of crops are experiencing drought conditions and 76 million people are affected by drought, according to the National Integrated Drought Information System. Globally, more than 1 billion people, nearly one-sixth of the world’s population, suffer from chronic hunger and malnutrition, and drought is a major factor.
NASA and NOAA scientists have spent decades developing tools to help state and government officials plan for drought and food shortages. One of them is the Vegetation Health Index, or VHI. Using data from the JPSS program’s VIIRS instrument on the NOAA-20 satellite, the product shows crop health across the globe represented in color-coded maps. Green and blue indicate lush, healthy growth; red shows areas that are dry and sparse.
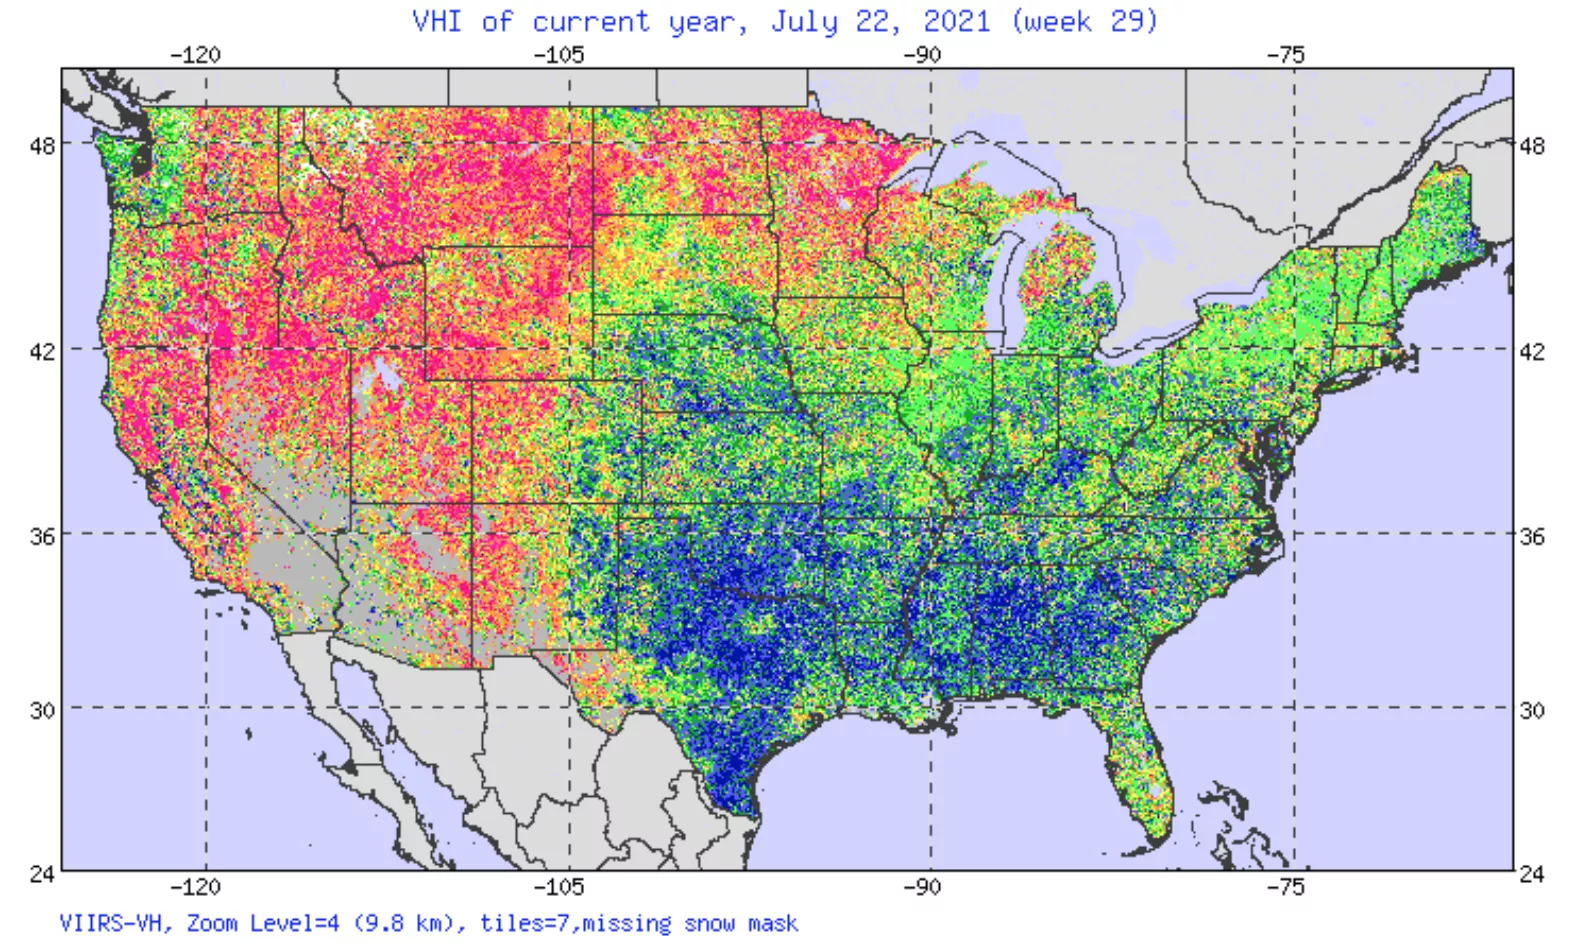
This Vegetation Health Index map shows crop health in the Western United States from July 22, 2021. Credits: NOAA STAR
The Vegetation Health Index was created in the mid-1990s by a research scientist in NOAA's meteorology and climatology division named Dr. Felix Kogan. In the past decade, the number of people using this product has jumped from about 2,400 in 2010 to about 69,000 in 2020, Kogan said.
Laura Haskell of the Utah Division of Water Resources coordinates the state of Utah’s official recommendation to the U.S. Drought Monitor map, which shows the drought status for each region of the United States, and plays an important role in decision-making involving agricultural reimbursements and other government assistance. Data from the Vegetation Health Index informs that recommendation, she said.
And it has a bigger role to play in what Eric Luebehusen, a meteorologist at the U.S. Department of Agriculture, calls “crop intelligence.” The USDA has a small but mighty team of meteorologists engaged in a major effort to develop estimates of crop production in more than 120 growing regions, covering 35 countries. They do this for major row crops, such as corn, wheat, sunflowers, soybeans, barley, cotton and rapeseed—and they rely on the VHI to help create these yield estimates.
What’s more, the research the VHI informs just might be protecting the price of your groceries. Knowing how crops are faring in other countries informs decisions about planting, food prices and foreign market exports, said Mark Brusberg, chief meteorologist for the USDA.
For example, said Brusberg, who monitors crops in Brazil, “if an area of the Southern Hemisphere is experiencing drought and there’s going to be a shortage of corn, it might impact prices in the U.S. as well, and farmers might decide to plant more corn here.”
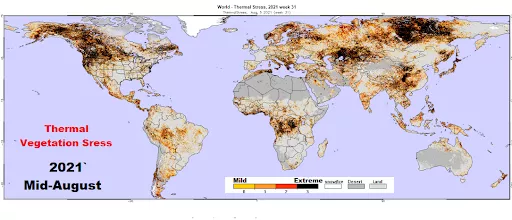
This Vegetation Health Index map from mid-August, 2021 shows how regions globally are being impacted by thermal, or heat stress. Credits: NOAA STAR
These estimates go into a monthly report that forecasts supply and demand for major crops called the World Agricultural Supply and Demand Estimates.
"The balance sheets maintained by the USDA that track production and trade not only help the market establish prices,” Brusberg said, “but they also provide valuable information to U.S. producers for decision making at the farm and ranch level."
The Great Grain Robbery
The need for crop intelligence dates back to 1972. In July of that year, the Soviet Union purchased 15 million tons of wheat, corn, soybeans and barley from the United States at low subsidized prices. Russia was experiencing severe drought and needed foreign grain. But the massive purchase, which took the United States by surprise, depleted the country’s grain stocks and caused wheat prices to soar, resulting in a domestic food crisis.
Later nicknamed The Great Grain Robbery by Sen. Henry M. Jackson, the event highlighted the need for global agricultural monitoring, and it just happened to coincide with a satellite that could provide just that: NASA’s Landsat 1.
Landsat 1 launched into space that same month, allowing for the first-ever view of drought and crop conditions from space. This convergence of events prompted NASA to team up with the U.S. Department of Agriculture (USDA) and NOAA to develop, in 1974, the first satellite crop production forecast: The Large Area Crop Inventory Experiment, or LACIE.
Dr. Forrest Hall was a project scientist for LACIE at NASA’s Johnson Space Center, and one of LACIE’s creators.
In the early days of Landsat 1, Hall’s team would print out gray-scale satellite maps of the world, tape them as a mosaic to the wall of the conference room and study them, drawing squares to locate fields. They trained algorithms to distinguish between the radiometric signatures of individual crops in the satellite data. Then they validated the maps themselves, tromping through corn, wheat and soybean fields in Ohio and Indiana to see if the crops were indeed growing as the models said.
It was a couple of years later that the LACIE program, an effort to provide global estimates of crop yields, began. This was considered a high-priority project by the U.S. government and the data highly sensitive. When they overestimated or underestimated, it showed up in the markets.
“We briefed President Ford at one point on the Russian wheat crop,” Hall said.
It was an exciting time, Hall added, and a lot of work. “We spent a lot of hours away from our families.”
Dr. Kogan was also well suited to the task of monitoring vegetation from space. He had been making crop predictions in the Soviet Union, using precipitation and temperature models. In fact, he correctly predicted in 1972 that the grain yield would be well under the amount needed to meet consumption needs. He moved to the United States because he wanted to do similar work, but globally, and incorporate data from satellites.
As the years passed and more satellites launched, the ability to do this kind of agricultural monitoring became increasingly important and vegetation health products increasingly advanced.
Observing Crops as They Grow
Like other vegetation maps, Kogan’s Vegetation Health Index uses a formula called Normalized Difference Vegetation Index, or NDVI. NDVI is calculated by measuring both the visible and near-infrared light that bounces off vegetation. Chlorophyll in a plant absorbs visible light but reflects near-infrared light. If the reflected radiation is greater in the near-infrared wavelengths than in the visible, then the vegetation in that particular pixel is likely to be greener and more lush.
But the VHI is unique in that it combines NDVI with temperature. Temperature gives insight into extreme heat or freezes that might damage crops. Because of this, VHI and other satellite-based indices also allow scientists to monitor different stages of the crops as they grow, which makes the resulting crop yield predictions more accurate.
Crops need certain ambient air temperatures for growth. Spring wheat, for example, needs a daily average temperature of at least 41 degrees Fahrenheit to grow, corn needs at least 50 degrees Fahrenheit, and cotton won't grow until the daily average is closer to 60 degrees.
Caption: In Russia, lingering impacts from the Autumn drought on the winter wheat crop were evident in early Spring. This map shows the Vegetation Health Index in Russia on May 1, 2021.
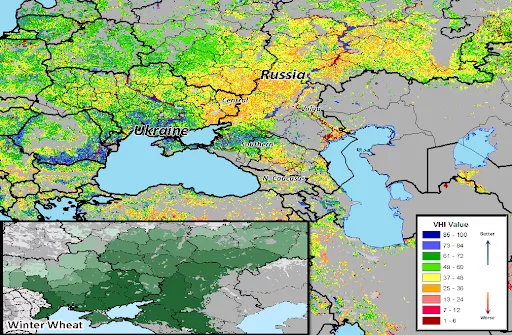
Credits: Agricultural Weather Assessments Group (USDA/OCE/World Agricultural Outlook Board)
In 2017, Luebehusen found that he could apply the VHI formula to the crop stage for a particular area in order to model the yield: corn in the silking stage in the Ukraine, for example. It was a game changer, he said.
“As long as you know when the crop was put in the ground, roughly, you can now estimate with a good degree of accuracy when the crop enters the key stages of development where weather matters the most,” Luebehusen said.
From the early days of the LACIE program, these global yield estimates grew out of an important interagency partnership between NASA, NOAA and the USDA. This partnership continues with the VHI product, as NOAA and NASA work together to launch and build the next satellite that will carry the VIIRS instrument, JPSS-2, which is slated to launch in 2022.
“If we didn’t have the VHI data, we’d be hosed,” Luebehusen said. “It’s become an integral part of our operations.”