
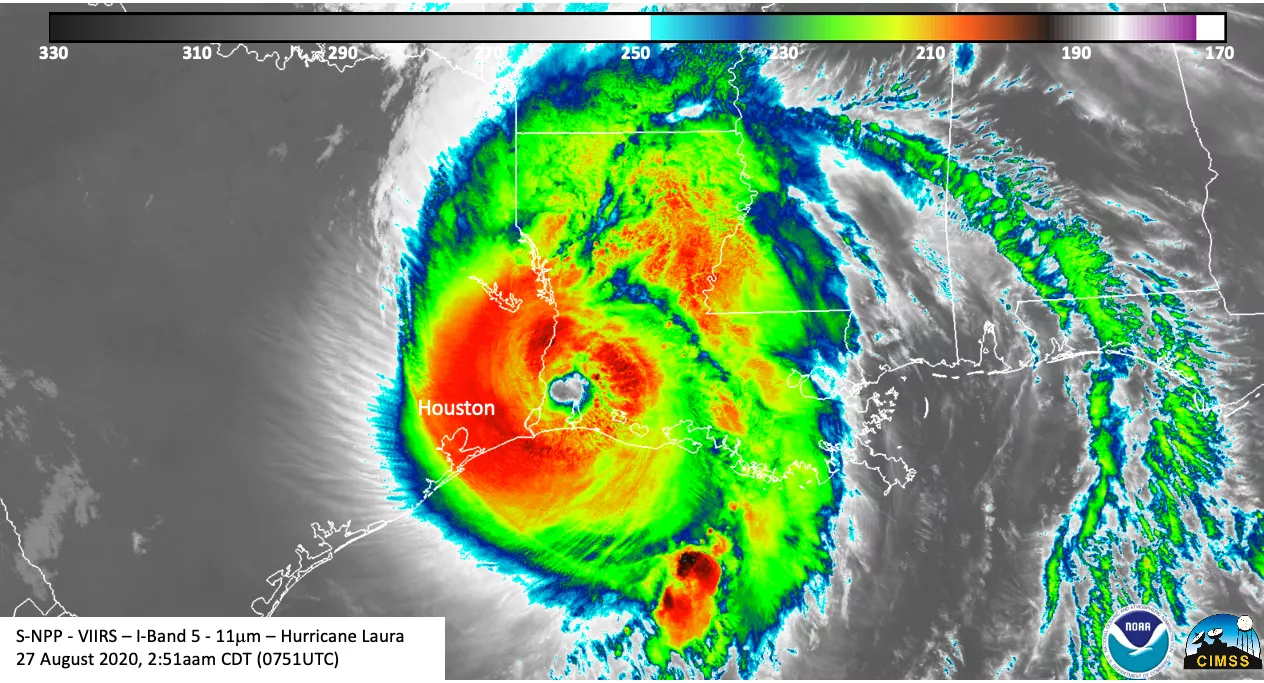
About two hours after Hurricane Laura made landfall Thursday morning, hammering the Louisiana and Texas coasts with 150 mile-per-hour winds and an “unsurvivable” storm surge, the VIIRS instrument on the Suomi-NPP satellite captured this image of the storm. The infrared image shows intense circulation and a clearly defined eye just north of the Gulf coastline and east of the Texas border.
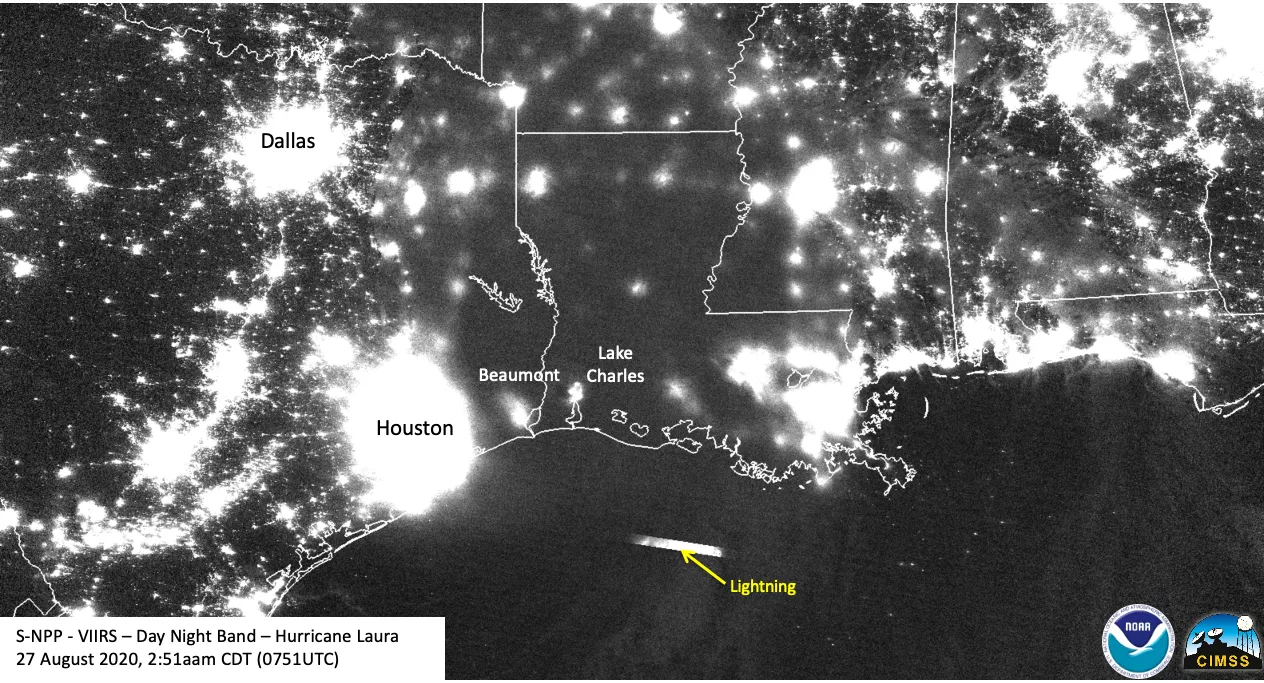
This corresponding nighttime Day-Night Band image below, also captured by VIIRS at 2:51 am CDT, shows a lightning streak in the Gulf and some lights still on in parts of Lake Charles, La., and Beaumont, Tex.But more than half a million people in Louisiana and Texas were without power Thursday afternoon, according to PowerOutage.us, which tracks outages across the United States from various power utility companies.
By 1 pm, Laura had been downgraded by the National Hurricane Center to a tropical storm, with maximum sustained winds at 65 miles per hour and water levels still elevated along the Gulf Coast. It was marching northward at 15 miles per hour across Northern Louisiana, expected to weaken to a tropical depression this evening and move across Arkansas tonight.
Since slamming into the coast, the storm has destroyed buildings, blown windows out from high rises, downed trees and power lines, and ripped the top off a bridge.At least four people have died, all related to falling trees, said Louisiana Gov. John Bel Edwards of Louisiana during an afternoon press conference.
Firefighters are battling a chemical fire caused by storm damage at a facility in Westlake, La., and the NEXRAD Doppler radar at the National Weather Service office in Lake Charles is down, according to images shared on social media , which showed that the dome and radar had been torn from the tower.
The Advanced Technology Microwave Sounder (ATMS) on Suomi-NPP, provided “a glimpse into the inner structure of the storm Thursday morning, showing well-defined circulation with convection completely surrounding it, with the coldest cloud temperatures centered on the northeast side of the eye,” according to William Straka III, a researcher for the Cooperative Institute for Meteorological Satellite Studies at the University of Wisconsin-Madison.
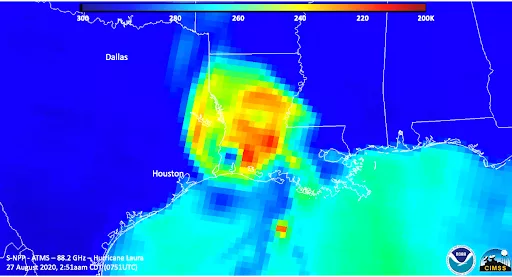
This is also where the most intense rain rates were found by the Microwave Integrated Retrieval System (MiRS) Rain Rate product, which is derived from ATMS, and part of the Climate Prediction Center morphing method (CMORPH2), a NOAA product that provides precipitation estimates from satellites.
The following animation shows the temperature differences between the core of the hurricane and its surrounding atmosphere, as observed by ATMS on the Suomi-NPP and NOAA-20 satellites as the storm gathered strength and intensified. This kind ofwarm core is typical to the structure of a hurricane, as described in this article from the journal Geophysical Research Letters. The larger the area of the core and the higher the temperature difference between the warm core and the area surrounding it, the more precipitation is produced.
The storm surge was not as severe as anticipated, but its outer band is still powerful and pushing into Corpus Christi, Texas, said Gov. Edwards during the press conference.
“We are getting reports now that water continues to rise,” he said. “Not as quickly as we had feared. But what I’m trying to tell people is, in your particular area, you might not have seen the water at its highest yet, so be cognizant of that.”