
NOAA and NASA’s Joint Polar Satellite System (JPSS) provides data and imagery to scientists, businesses, planners, and government agencies so that they can make maps with helpful information.
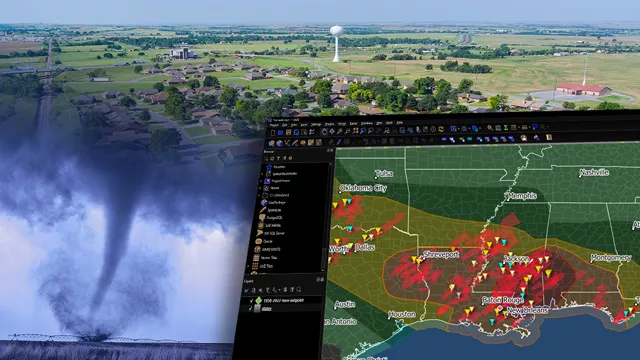
GIS stands for Geographic Information Systems. These are information systems, typically presented as maps, they keep track of events, facts, activities, objects, and where they are. GIS maps are usually combined with remote sensing (satellite and air photo imagery) and global positioning systems (GPS) A GIS is a map linked to a database. It gives you a cartographic representation of an area, but it also provides additional data about the location and can relate that data mathematically, statistically, and logistically in ways that would be too complicated to process without a computer. This activity walks students through the process of making a basic GIS map that documents tornado touchdowns.
Knowing where something happens is critically important. From building a school to solving an environmental problem, location is a key component. GIS allows the user to make spatial connections when the information is too overwhelming.
Materials
QGIS works on most operating systems but is not recommended for tablets or smartphones.
A GIS is Broken Into
- Themes/layers – this is all of the geographic information. These two words are interchangeable. They are made up of points, lines, and polygons that are tied to a real place.
- Attribute Tables – detailed data related to geographic information. This is a database that goes along with the points, lines, and polygons. Map elements- Scale, North arrow, explanation of symbols
- Search capabilities
- Metadata – Information about how the data was created. Themes/ layers are the geographic information that you are presenting on the map.
Themes and layers make up the cartographic part of the GIS. The themes are represented as shapes that are called points, lines, and polygons. These components can give you important information without relying on the data tables but they are just the surface of the map. Points are used when you have one spot that you want to show. This could be a location of a well, a fire hydrant, or a sighting of a rare bird. Lines are anything that can be represented linearly like boundaries, roads, or streams. Anything, where the shape and size are important, can be shown as a polygon. Lakes, buildings, and cities are examples of polygons. Behind the scenes of these features are attribute tables. These tables are linked to the points, lines, and polygons and contain data about them. An attribute table can be an extensive database and it will be the information that you use to make your GIS searchable. The more data you have in your tables the more robust your GIS can be. Examples of data in attribute tables can be addresses, names, well depths, numerical statistics, or acreage.
Metadata is data about the data. This is information such as the author, date of data collection, method of data collection, and any known errors. Metadata is vital for troubleshooting errors in your GIS. For example, you wouldn’t want to make a flood map with elevation data that had an error of ten feet! Your final product would be inaccurate. You wouldn’t build a scientific application using data provided by a group with a known bias. Paying attention to metadata is essential when you are choosing datasets to add to your GIS.
GIS is used for city planning, the government, emergencies, science, marketing, land use, conservation, education, and mapping. Whether you know it or not, GIS already plays a big part in your everyday life.
- Alarm Clock – the power company uses GIS to manage assets and repair lines
- Shower – the water utility predicts water usage
- Marketing in the mail
- Bus routes, trains, Department of Transportation planning
- Choosing the location of a new business
- Food – prices are lower as a result of GIS and precision agriculture
Computers are getting faster which allows us to use GIS more and expands what we can do. GPS accuracy improvements, increased access to high quality remote sensing imagery, and data collection apps on mobile devices have made it easier to collect data that is accurate and useful in the field. Many GIS data sources are available for free online and many agencies like NOAA and NASA are sharing data with the public. The more information you can add to your map and attribute tables the more useful your GIS will be. Internet platforms and open source software are bringing GIS to everyone and making it more user friendly to learn how to use GIS and start making maps.