
The western U.S. has seen record-breaking high temperatures over the past week as a heat dome, or mass of warm air, blankets the Pacific Northwest. This essentially occurs when a “mountain” or “dome” of warm air rises into the atmosphere, gets pinched off by the jet stream, and blocks new weather systems from moving in. The extreme heat, coupled with a severe drought this spring and summer in the region, has combined to significantly raise the risk of wildfire from both human and natural hazards, such as lightning.
As the drought and heat wave stretches on, vegetation in these areas dries out, creating ample fuel for potential wildfires. But how dry is it?
NOAA-20 and Suomi NPP, part of the Joint Polar Satellite System (JPSS), detect and monitor drought and plant health using observations from their Visible Infrared Imaging Radiometer Suite (VIIRS) instrument. The VIIRS instrument, which views Earth in visible and infrared wavelengths, detects the “greenness” of vegetation, which shows how many plants there are, how leafy they are, and how healthy they are. Scientists are able to use that data to color code areas on a map where vegetation is stressed based on a scale of zero (most stressed) to 100, due to lack of water and extreme temperatures. Additionally, its Active Fire Product provides additional information on active thermal anomalies. This information is used to monitor drought and estimate crop yields, but can also be used to estimate fire risk around the world.
The data from June 24, 2021 show that western vegetation is extremely stressed, especially as compared to June 2020 and other, more average years.
Between June 25 and 27, the Geostationary Lightning Mapper (GLM), an instrument on NOAA’s geostationary satellites, GOES-16 and GOES-17, observed significant lightning activity across the western U.S. from summer storms. GLM monitors lightning activity continuously over the Americas and surrounding ocean regions, collecting information such as the frequency, location and extent of lightning discharges to identify intensifying thunderstorms and tropical cyclones.
Lightning from a June 25 thunderstorm in northern California sparked the Lava Fire, which has quickly grown to 17,591 acres, according to the InciWeb Incident Information System, and is currently 19 percent contained. The Shasta-Trinity National Forest, which is managing the fire response effort in coordination with Cal Fire, attributed the rapid growth of the fire to “strong, erratic winds and dry fuels.”
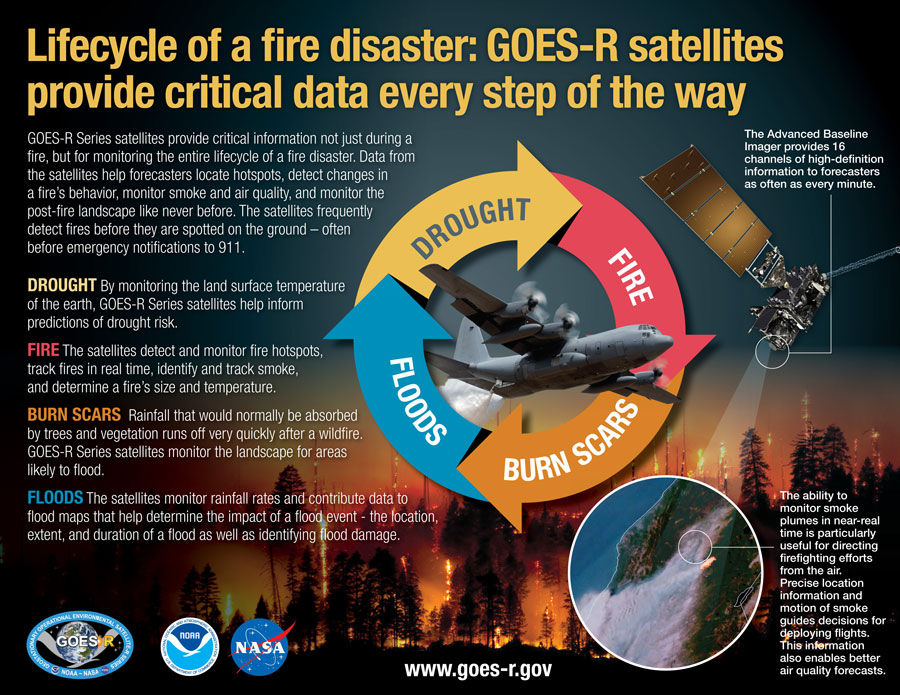
GOES-16 and GOES-17 have kept constant watch over the area from more than 22,300 miles above the Earth’s surface, providing continuous updates on the fire, though at a coarser resolution than the JPSS satellites, which orbit closer to the planet. The Advanced Baseline Imager (ABI) on these satellites is capable of detecting heat signatures and changes in fire behavior faster and more accurately than previous versions of this sensor, as well as help predict the motion of fires in real time. The ABI measures energy at different wavelengths that is either reflected (visible or near infrared) or emitted (infrared) from Earth’s surface. Thus, it is able to measure the size, temperature, and radiative power of fires.
For example, the GOES-R fire detection and characterization data product uses both visible and infrared channels to locate fires and learn about their characteristics. Fire Temperature RGB imagery is used to manually locate and monitor fire hot spots, which are shown as red, orange, yellow, or white as it grows hotter. This type of imagery is particularly useful to identify new hot spots and the direction those hot spots are moving, especially for fast-growing or newly-formed fires. Also, GeoColor imagery combines data from multiple channels from the ABI so it looks similar to what we would see with the naked eye, allowing us to easily spot smoke plumes from fires rising into the atmosphere.
Satellite imagery of several of the fires, including the Pack Creek and Bear Fires in Utah and the Telegraph Fire in Arizona, reveal impressive plumes with thick pyrocumulus clouds, which form when there is enough moisture and atmospheric instability over an intense heat source and smoke."
Suomi NPP and NOAA-20 have been able to track the Lava Fire’s changes overnight through the use of the Day-Night Band, which can see weather patterns and environmental events in low-light conditions. Additionally, when passing over twice a day, the VIIRS instrument provides fine-resolution imagery of the fires, which helps to detect smaller and lower-temperature fires, as well as better map the perimeter of larger fires. Additionally, the satellites collect detailed information about fire intensity. This data helps to predict the height, thickness and movements of wildfire smoke, which can help inform air quality advisories and warnings to protect public health in the area. After a fire, the satellites can provide high-resolution looks at the burn scars, which can help to forecast post-fire weather events like mudslides and debris flows.
The benefits provided by the latest generation of NOAA satellites aren’t just seen during a fire but are important in monitoring the entire life cycle of a fire disaster. Data from the satellites are helping forecasters monitor drought conditions, locate hot spots, detect changes in a fire’s behavior, predict a fire’s motion, monitor smoke and air quality, and monitor the post-fire landscape like never before.