
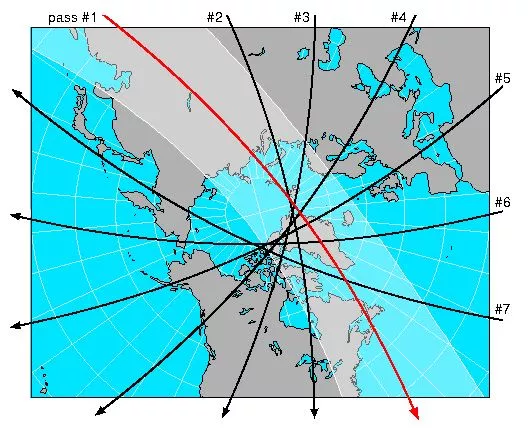
Shortly after NOAA-20 (formerly JPSS-1) launched into space on November 18, 2017, it joined its predecessor—the Suomi NPP satellite—in the same polar orbit. This means that, although the two spacecraft are separated in time and space by 50 minutes, they are traveling the same path as they circle the Earth 14 times a day, each imaging the entire globe twice each day.
Why have two satellites in the same orbit?
In a word: continuity. Suomi NPP launched on October 28, 2011, which means the satellite has been orbiting the Earth for more than six years—one year beyond its design life. How long it will remain functional is anyone’s guess, but the data Suomi NPP provides is too important to postpone replacing it until a problem occurs. That is why NOAA-20, which is destined to take Suomi NPP’s place as NOAA’s primary polar-orbiting satellite in the afternoon orbit, launched while Suomi NPP is still operating reliably.
“We can never predict the end of life of a weather satellite, and because polar orbiting weather satellites are so critical for weather forecasts, we have to make sure we have at least one in orbit within its design life,” said Mitch Goldberg, Chief Scientist of the Joint Polar Satellite System Program. “So, having two satellites in the same orbit ensures that users will still have data for forecasting and environmental monitoring if one of the satellites experiences a partial or total failure.”
An added benefit of having two satellites in the same orbit is that, together, they will provide twice the data for forecasting the weather and monitoring the environment. It is important to note, however, that “double” does not mean “same.” As NOAA-20 and Suomi NPP orbit the Earth, the planet spins beneath them. Therefore, although they are traveling the same path 50 minutes apart, the imagers and sensors aboard each satellite will “see” different areas of Earth’s atmosphere, land and oceans.
More Data, More Often
Beyond capturing twice the data, having two satellites in the same orbit also means that this information will get to users more quickly than before. As seen in the animation above, Suomi NPP downlinks to only the JPSS ground system antenna at Svalbard, Norway (near the North Pole), while NOAA-20 downloads its data to the ground station antenna at Svalbard and the antenna at the McMurdo Station in Antarctica (near the South Pole). NOAA-20’s ability to downlink each time it passes an antenna at each pole is important, as it reduces end-to-end latency, or the time it takes the data to get from the satellite to the user. In fact, the data latency of NOAA-20 is said to be 96 minutes—a significant improvement over the 147-minute data latency of Suomi NPP.
The reduced data latency of NOAA-20 is the result of new hardware (two KA-band gimbaled antennas) not found on Suomi NPP and a more efficient ground system, which quickly ingests and processes data from both satellites. Once processed, the data are sent to the National Weather Service and NOAA’s other U.S. and international partners for assimilation into the forecast models that provide short-term and mid-range (3- to 7-day) forecasts.
More Coverage of Alaska and the Polar Regions
Nowhere is the need for timely data more pressing than in Alaska and the polar regions, where the remoteness or topography of the landscape limits the use of traditional forecasting tools, such as ground-based weather stations, radar, and sounding instruments attached to weather balloons (which are still widely in use). Even geostationary satellites such as GOES-16 cannot provide adequate coverage of the polar regions due to their position in space and the curvature of the Earth. Fortunately, polar-orbiting satellites can overcome these challenges. Within a given 24-hour period, NOAA-20 and Suomi NPP pass over Alaska and the polar regions several times a day.
To take advantage of these more frequent passes, the Geographic Information Network of Alaska (GINA) at the University of Alaska–Fairbanks has erected two direct broadcast antennas to receive polar satellite data and make it available even faster.
"Even the best satellite product does not help a forecaster or the forecast process if the imagery is available after the fact,” said GINA’s Eric Stevens. “We can get an image in front of a National Weather Service (NWS) forecaster within approximately 15 minutes of our contact with the satellite as it passes overhead. That is pretty efficient—and that helps NWS forecasters do their jobs."
Greater Environmental Intelligence
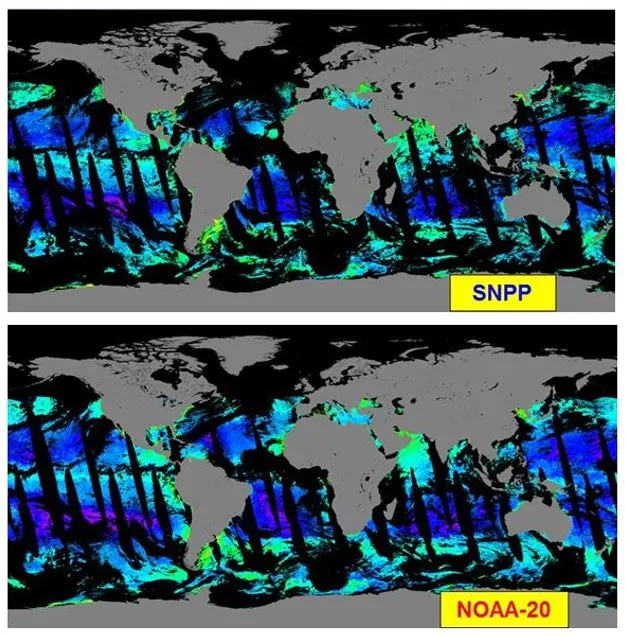
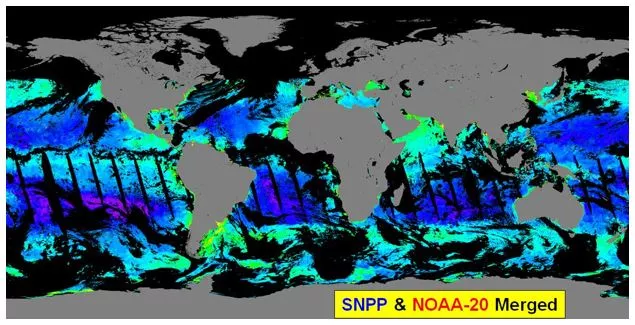
Meteorologists are not the only ones who benefit from having two satellites in the same orbit. The increased data and data products also support the ongoing efforts to monitor Earth’s ecological health. For example, the following ocean color images from Suomi NPP (top) and NOAA-20 (bottom) show how much green pigment (which is associated with the algae) is contained within the surface waters of the world’s oceans. * As seen here, both images show gaps in coverage, which are caused by atmospheric contamination (i.e., the interference of atmospheric particles with the imaging instrument’s ability to detect the surface of the water) and the viewing angle of the satellite. Although still present in the third image featuring data from both NOAA-20 and Suomi NPP (below), the gaps are smaller because the second satellite is looking (almost) straight down at the region the first satellite viewed at an angle. Thus, when the data from both satellites are combined, the result is a more complete assessment of ocean color.
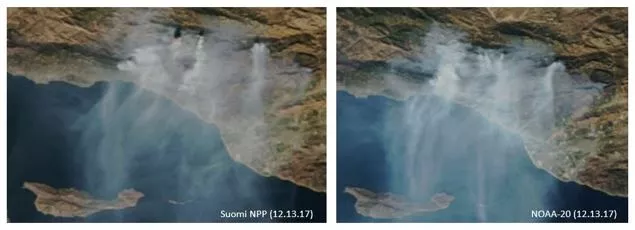
Efforts to detect and track of environmental hazards, including fires, volcanic ash clouds, sea ice and floods, also benefit from having a pair of satellites in the same orbit. For example, when fighting wildfires, emergency responders rely on NOAA’s polar satellites to understand weather conditions and identify “hot spots” with tools such as the VIIRS Fire Radiative Power Product. Such information is key when making decisions about where to deploy firefighting teams and other resources. In addition, the high spatial resolution provided by NOAA-20 and Suomi NPP enables the detection of small fires before they become larger.
Similarly, the aviation industry relies on polar-orbiting spacecraft to monitor volcanic ash clouds—a serious threat to aviation safety. Following the eruption of an Icelandic volcano in 2010, there was widespread disruption to airline schedules. To help companies get back on schedule, NOAA satellite data was used as a critical input in decisions as to how to re-reroute flights. This kept passengers out of danger and likely spared airlines from costly repairs to aircraft damaged by ash.
Two Satellites, One Orbit — Both Now and in the Future
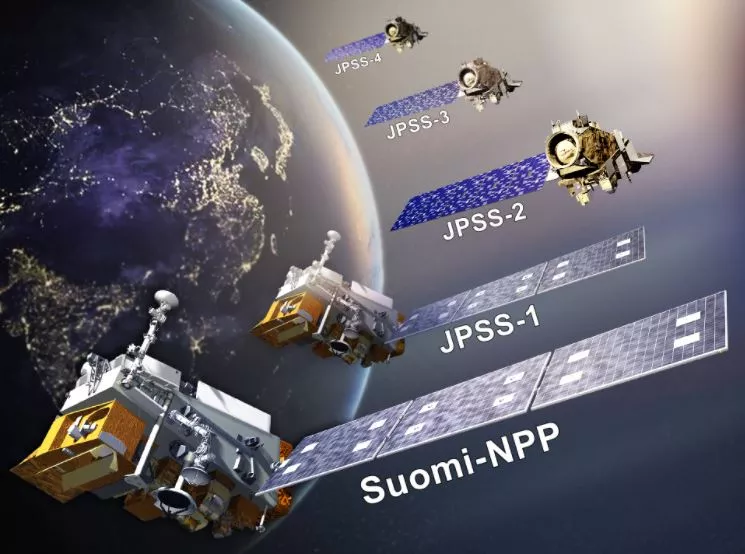
Eventually, the day will come when Suomi NPP fails and is deactivated. This does not necessarily mean, however, that NOAA-20 will orbit the Earth alone. The JPSS Program is already at work on JPSS-2, and have contracts on JPSS-3 and -4. Although the payloads of these future spacecraft are the same as those in orbit now, their anticipated operational lives will be seven years, with the potential to remain operational for even longer. Moreover, these satellites will be built and launched in an overlapping fashion through 2036 to ensure operational continuity and the sustainability of the critical data flows that Suomi NPP and NOAA-20 are contributing to now.