
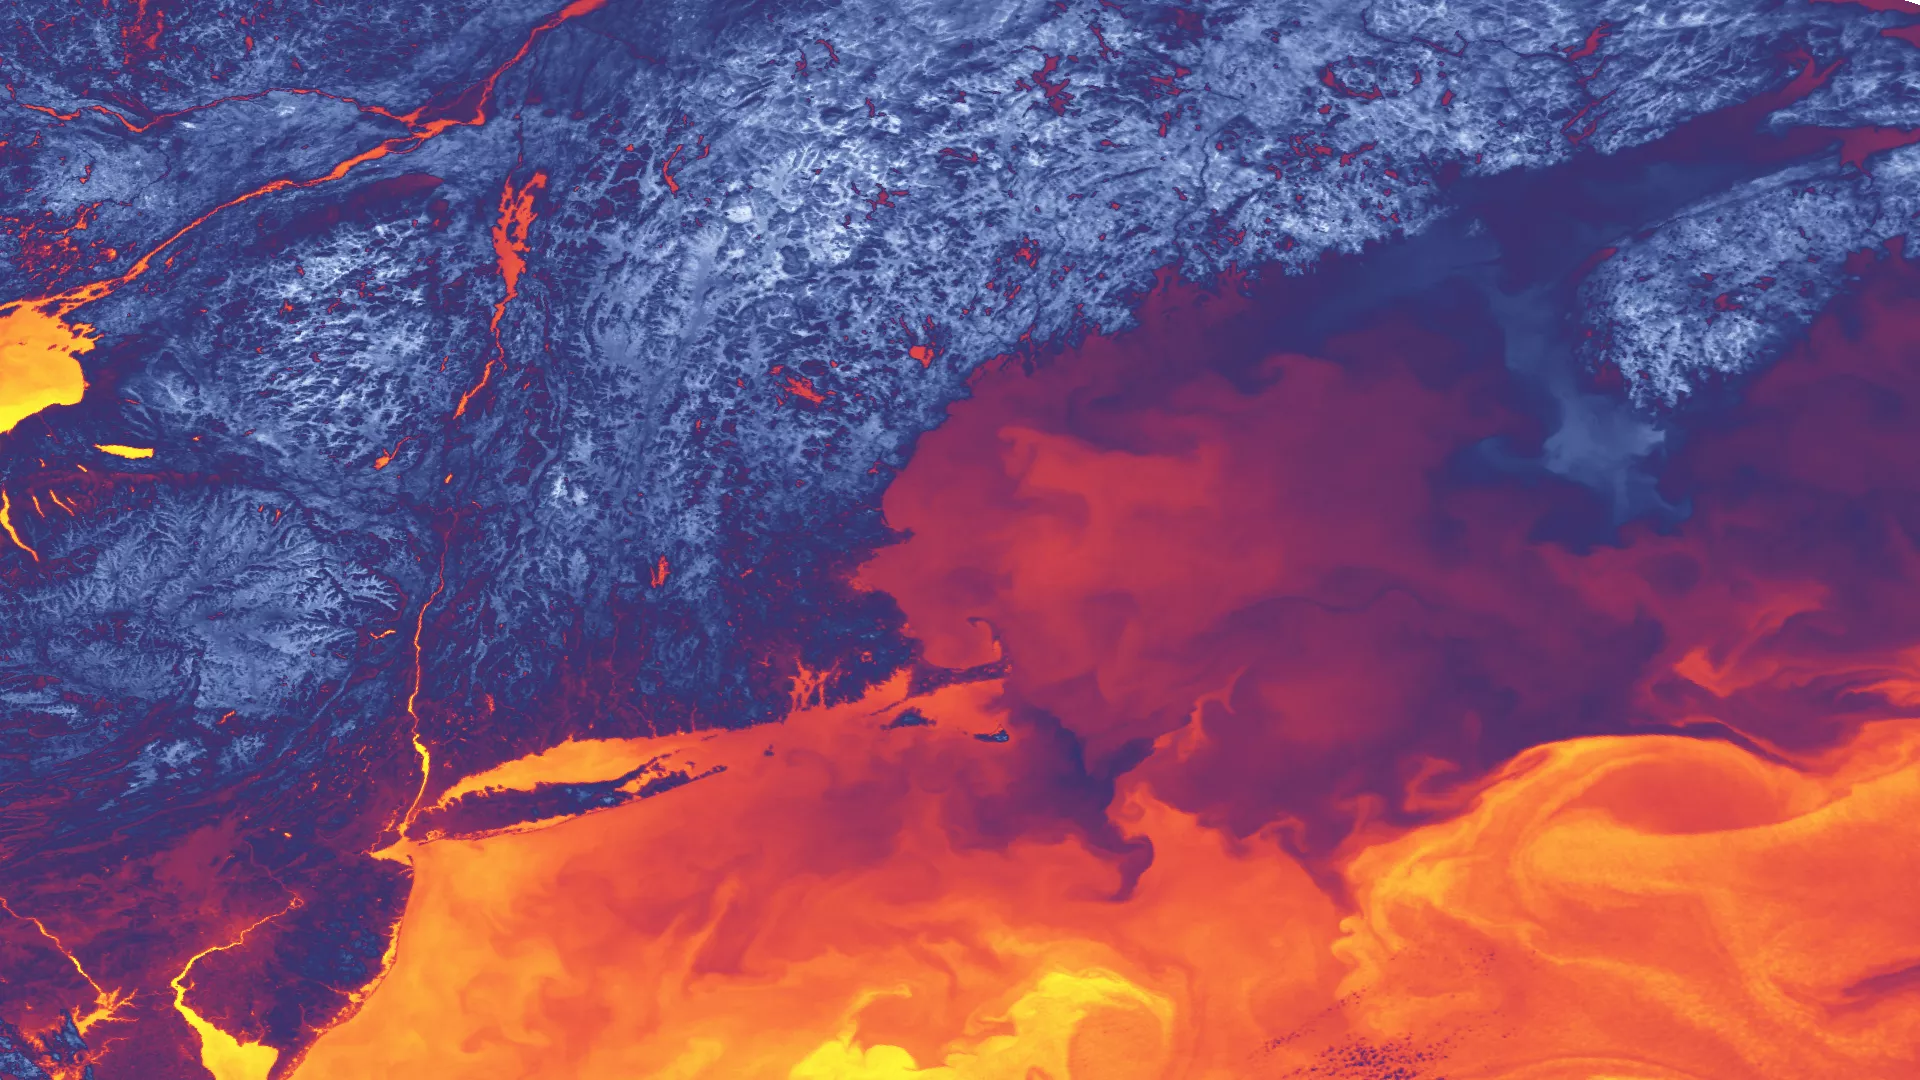
This image, captured on September 13, 2016, shows the difference in "skin temperature" -- the heat reflected off the Earth's surfaces -- among mountains and valleys, urban heat islands and colder low-population areas, and ocean current variations (including the warm Gulf Stream curling off of the coast). The white and blue areas are the coldest, while yellow areas are the hottest.