
GOES-16 and GOES-17, also known as GOES-East and GOES-West respectively, provide beautiful images of Earth. However, what you see on your television, computer, and mobile device are digital representations of the data these satellites capture, not actual photographs or videos. So how are these images created?
How Satellites “See” Earth
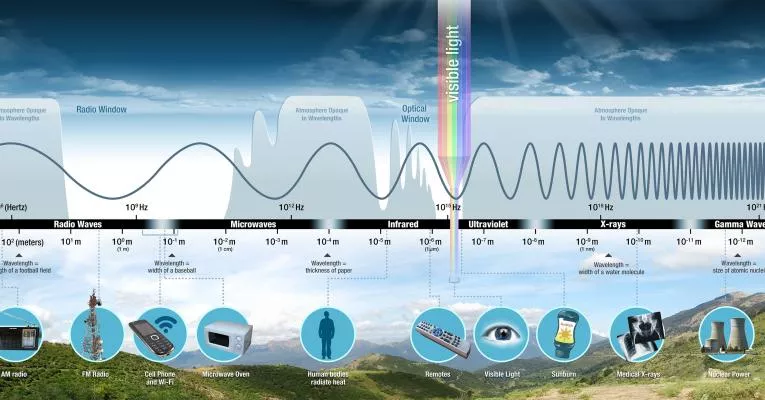
Satellite imagers use remote sensing to collect information about Earth from above. GOES-R Series satellites carry an instrument called the Advanced Baseline Imager (ABI), which measures energy at different wavelengths along the electromagnetic spectrum. The electromagnetic spectrum is the entire range of light that exists, from radio waves to gamma rays. Different objects absorb or reflect different wavelengths of light. ABI measures visible and infrared energy in 16 spectral bands, or channels.
Rather than capture an instant snapshot of the full Earth scene below the satellite, ABI scans “swaths” of Earth using two scan mirrors, one that moves from north to south and the other from east to west. After each east-west scan is complete, the north-south scan mirror moves to a new location to begin a new east-west scan. Twenty-two of these scans create a full disk (the entire scene that ABI can see).
Measuring Energy
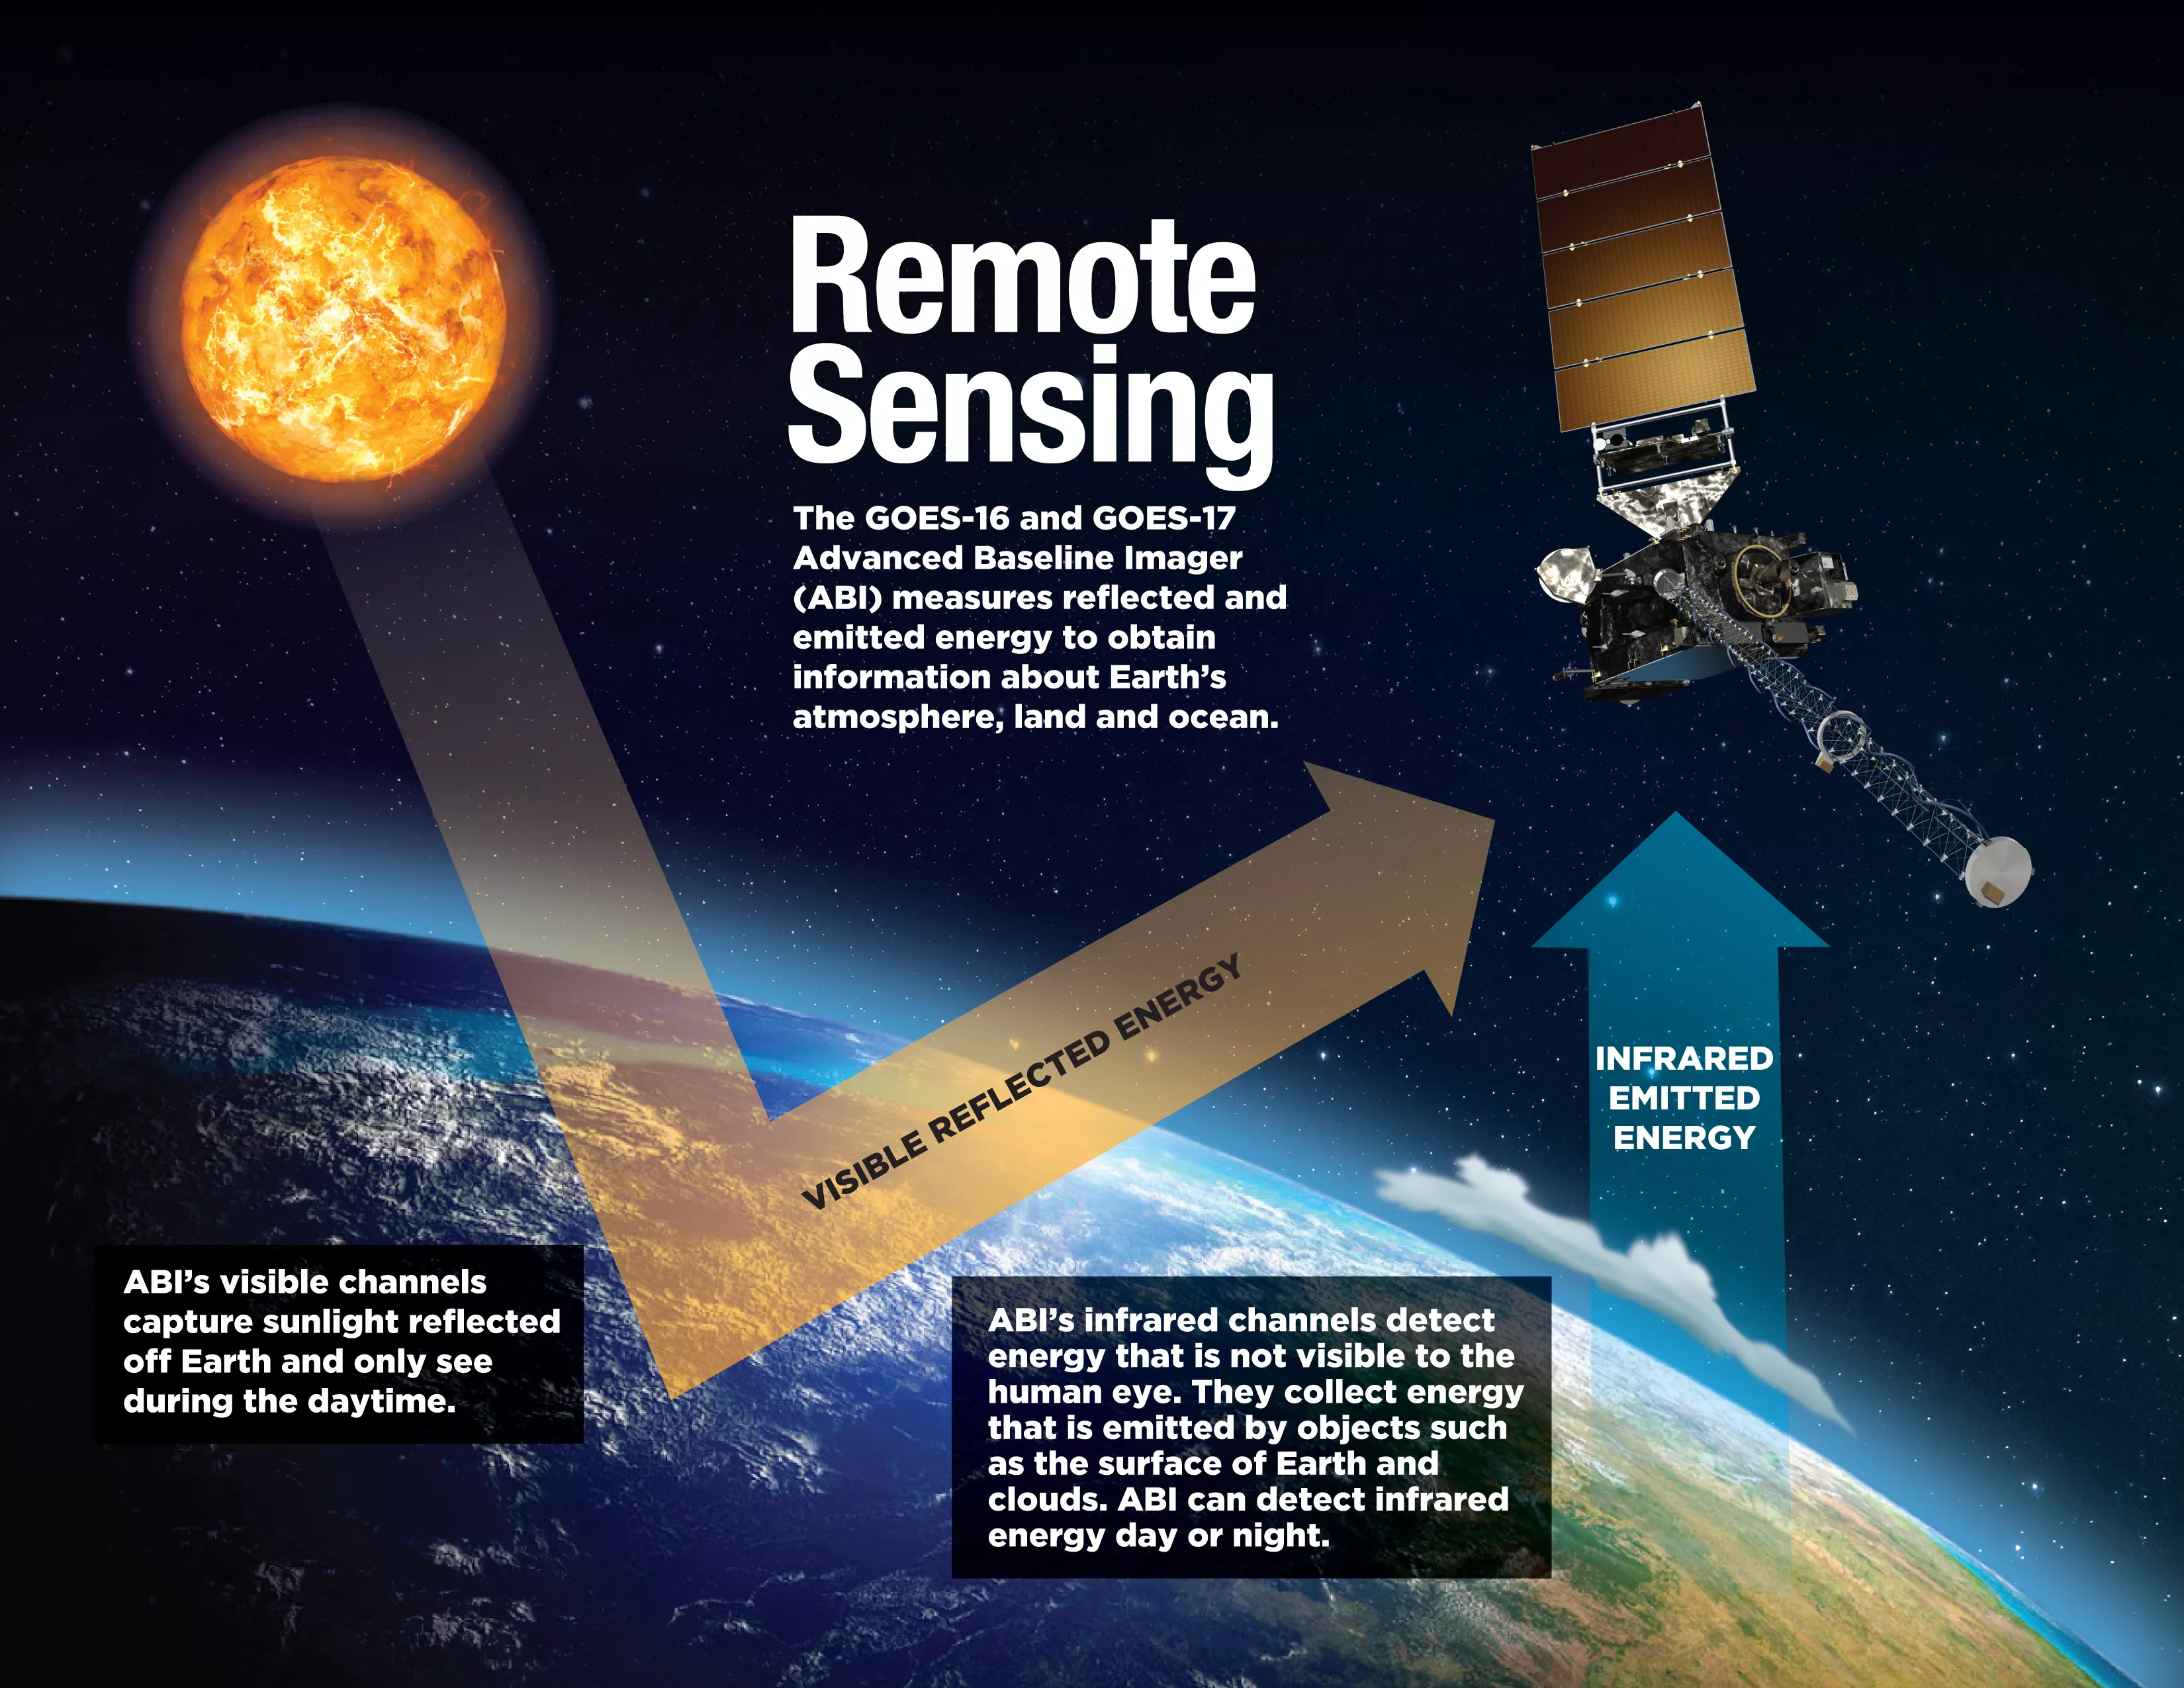
Each of ABI’s 16 channels measures the amount of reflected or emitted energy in a specific wavelength of light along the electromagnetic spectrum to obtain information about Earth’s atmosphere, land or ocean. ABI’s spectral bands include two visible channels, four near-infrared channels, and ten infrared channels. ABI’s visible channels only see during the daytime, much like our own eyes, because they only capture sunlight reflected off the earth. In contrast, ABI’s infrared channels detect energy that is not visible to the human eye. The infrared channels collect energy that is emitted by objects such as the surface of the earth and clouds. ABI can detect infrared energy day or night. Think of ABI as acting like night vision goggles, which use image enhancement technology to see all available light. Each ABI channel is useful for viewing a particular feature, such as cloud type, water vapor in the atmosphere, ozone, carbon dioxide, or areas of ice or snow.
ABI collects particles of light called photons. When photons strike ABI detectors, they generate an electrical charge in the detector that is proportional to the amount of incoming light. The ABI electronics read the value of the electrical charge and convert it to a digital signal. The ABI detectors are similar to those used in a smartphone or digital camera, but they are much more sensitive because they need to detect very small signals coming from far away.
Translating Satellite Data
Information from ABI is turned into radio waves and is transmitted to antennas on the ground. The information is then sent to computers at a satellite data processing center. This information is transmitted in binary code , a numeric language that uses only two digits: 0 and 1, arranged in eight-character strings that are understandable by computer software. A numeric value of the amount of light detected by each object is digitally recorded. The computer then translates the information into imagery.
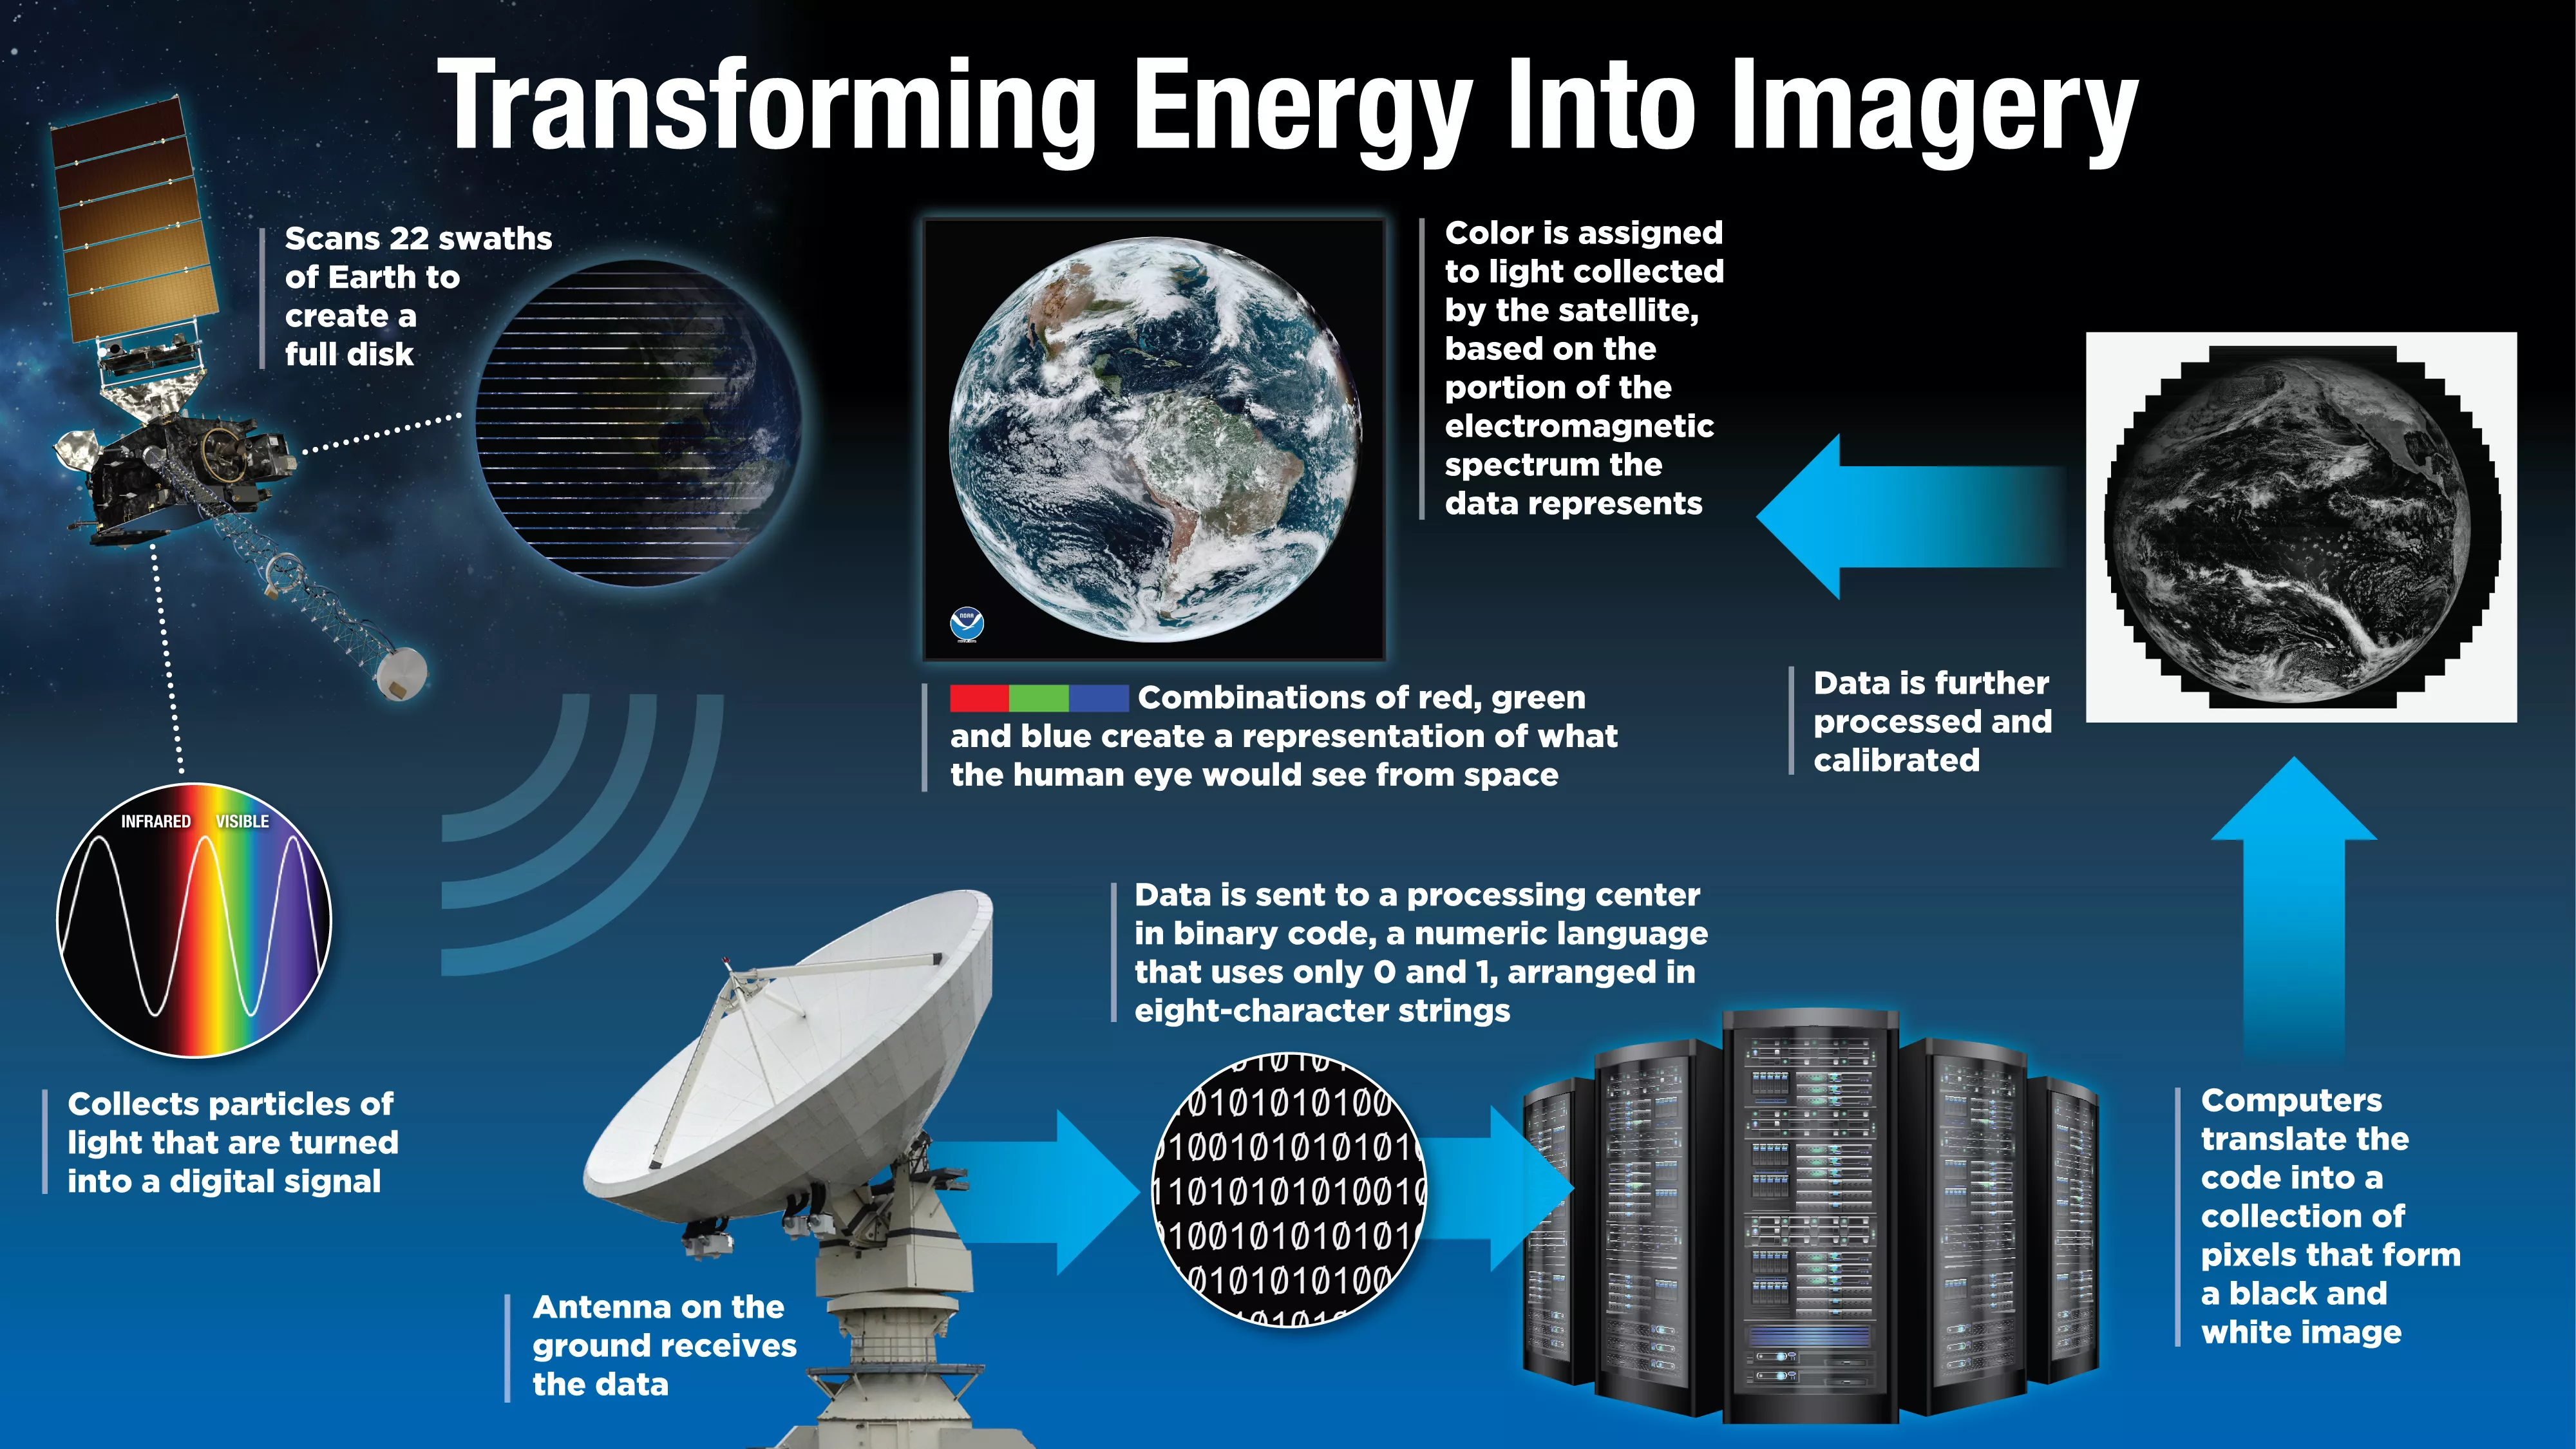
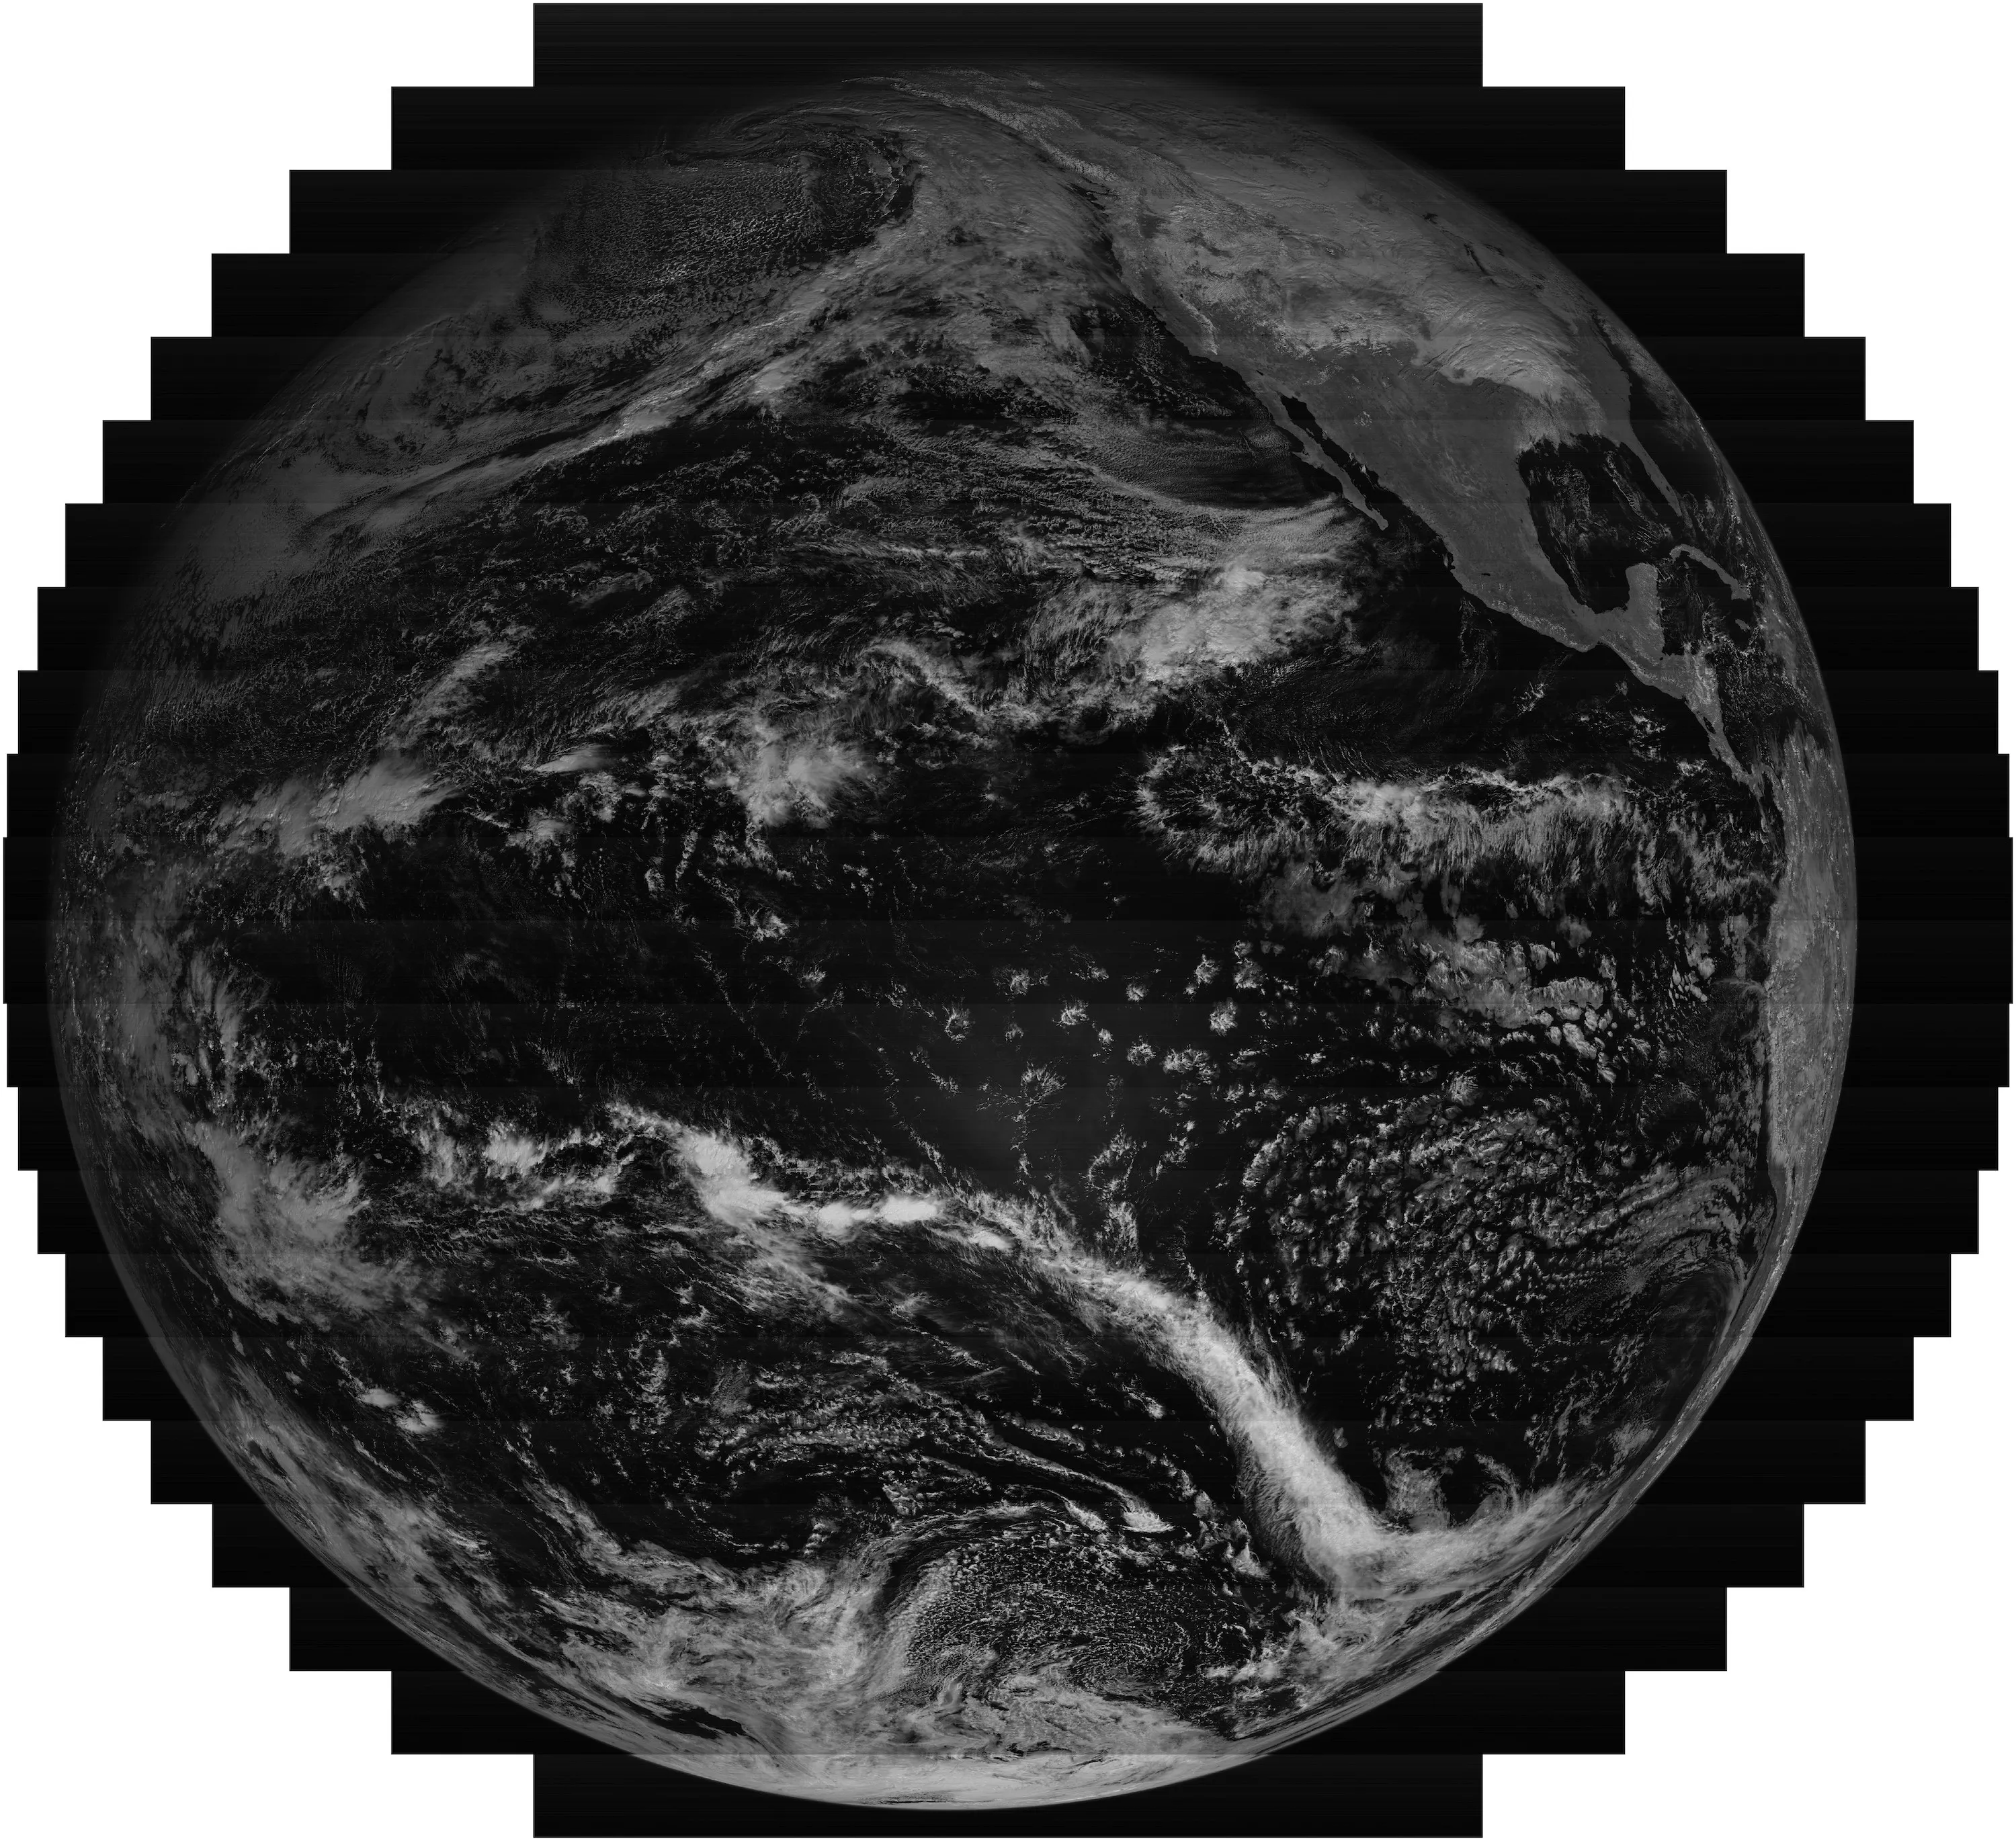
Satellite imagery, like pictures on television, is made up of tiny squares called pixels (short for picture elements). Each pixel in satellite imagery represents the relative reflected or emitted light energy recorded for that part of the image. The binary code information transmitted from the satellite assigns a value to each segment of the electromagnetic spectrum. These numbers can be converted to grayscale (each pixel in an image represents only an amount of light, and is composed exclusively of shades of gray) to produce a black and white image in pixel form.
Creating Color
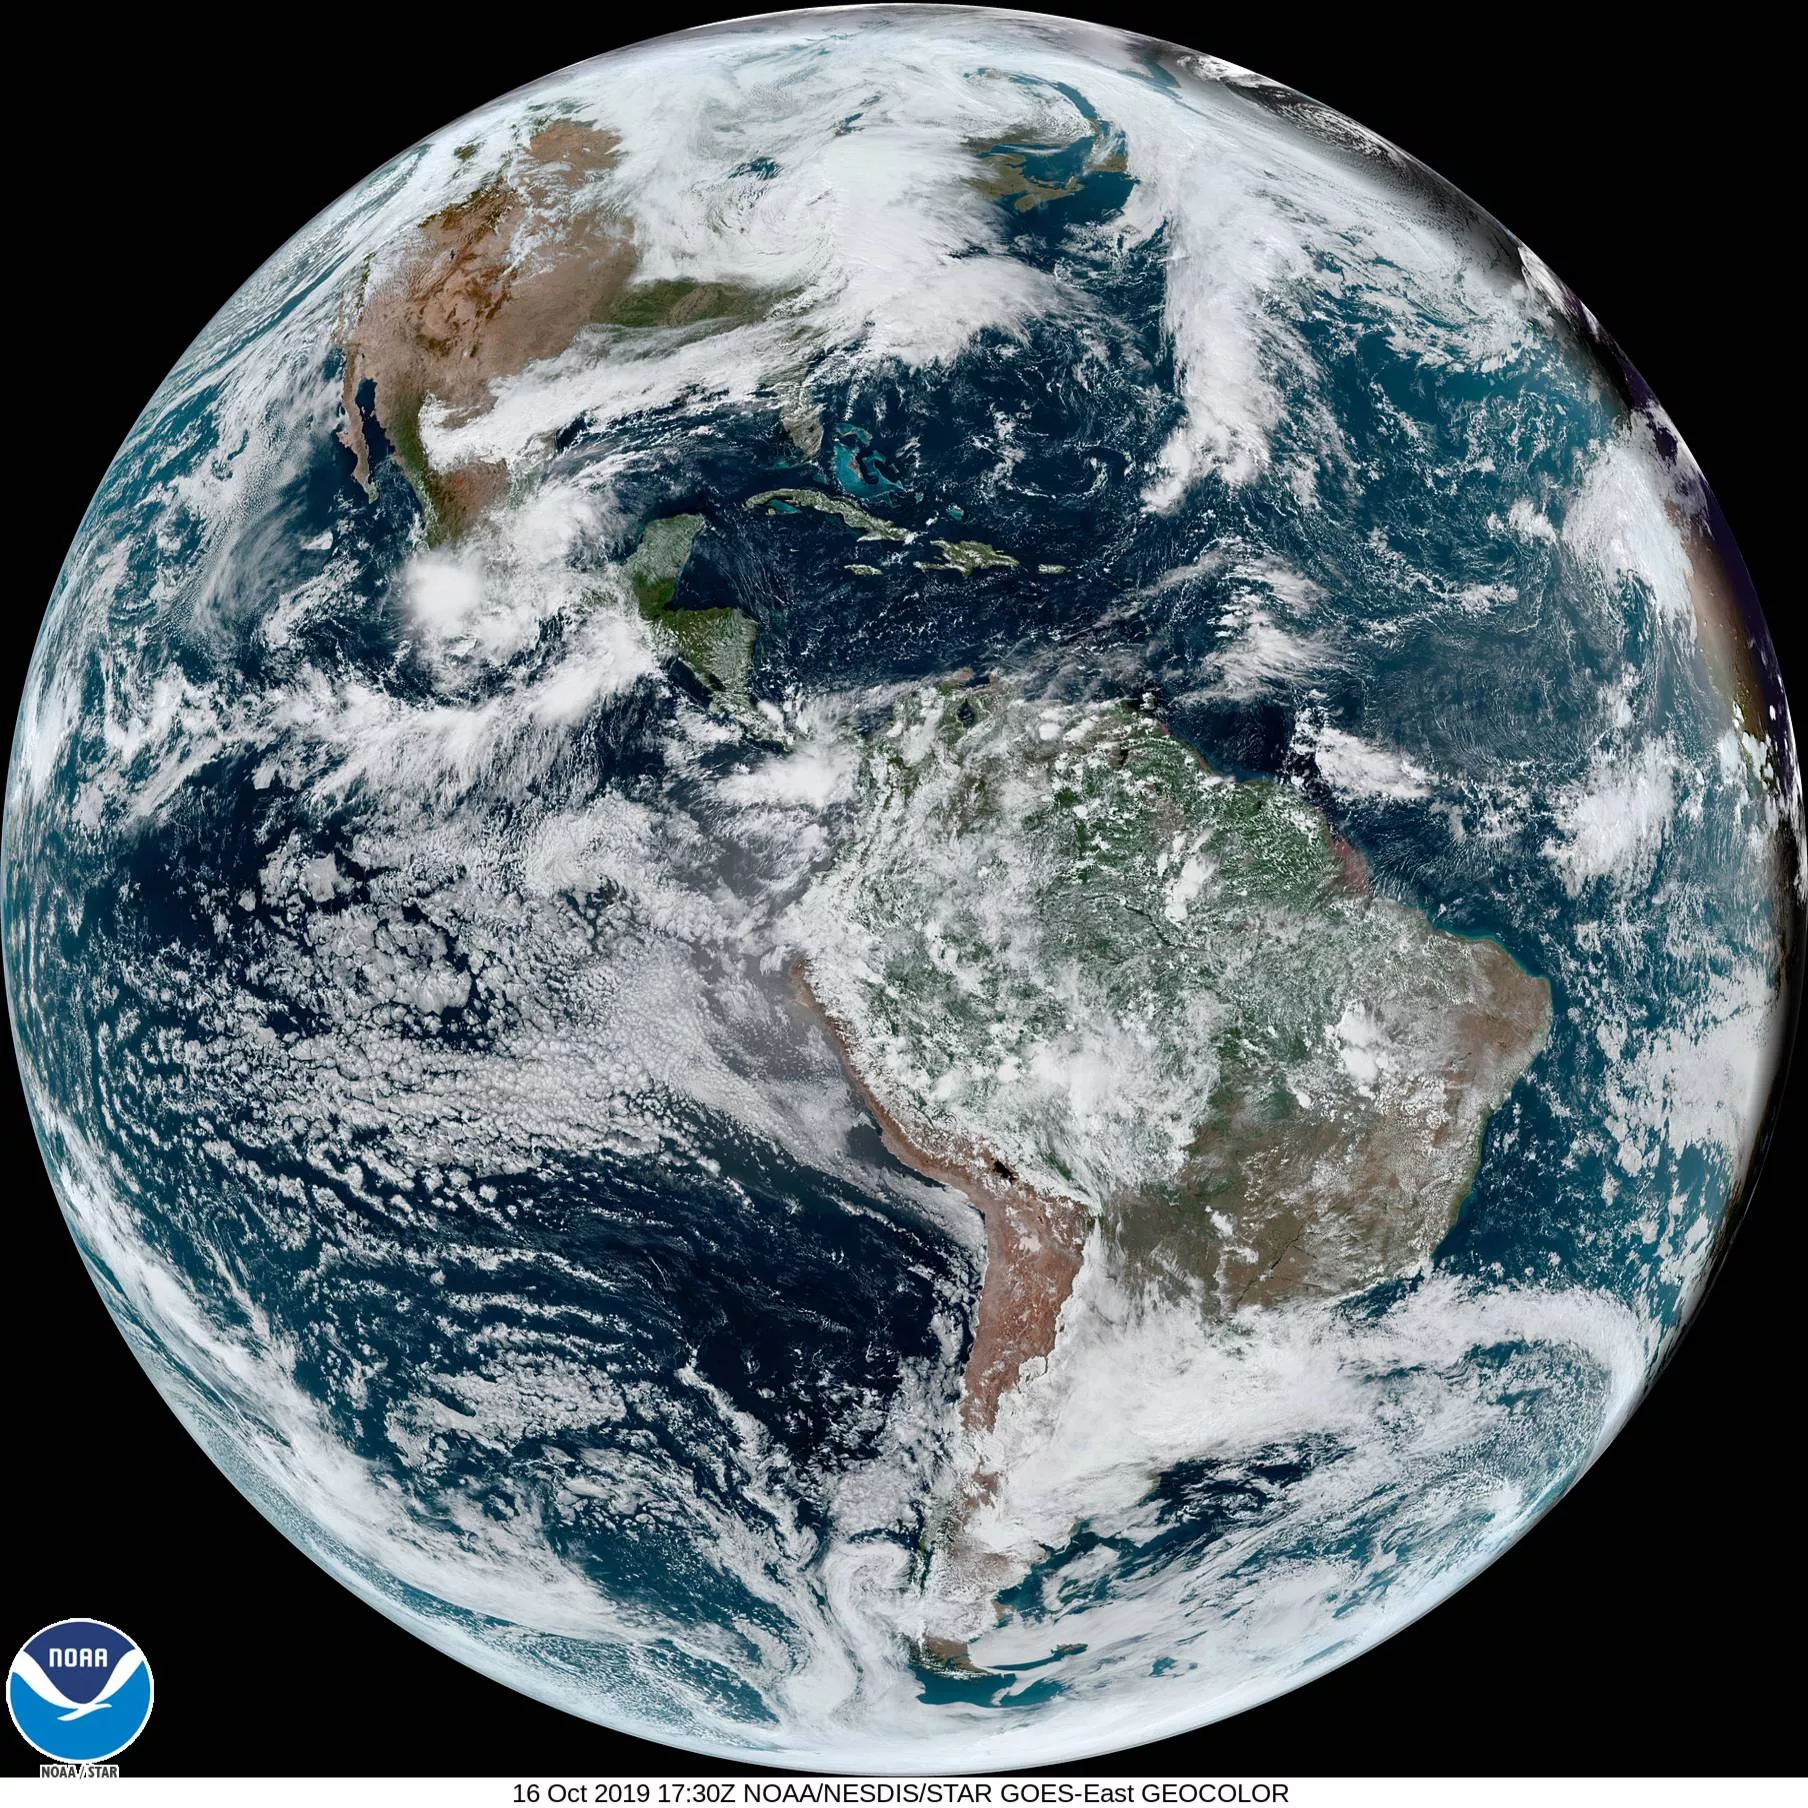
Scientists can assign colors to the “bands” of ABI data based on what color of light they represent on the electromagnetic spectrum. To build a composite image from satellite data that makes sense to the human eye, we need to use colors from the visible portion of the electromagnetic spectrum – red, green and blue. These three primary colors can be combined at different intensities to form all possible colors. The color red is assigned to the band that represents red light, and blue to the band of data that represents blue light. ABI does not have a true “green” band, so this information is simulated using a lookup table that was created using data from the Japan Meteorological Agency’s Advanced Himawari Imager, which is very similar to the ABI but contains a “green” channel.
Multispectral Imagery
Combining data from multiple ABI channels provides even more information. Certain combinations of data from different channels allow us to highlight features of interest. When combined in a particular “recipe” a single image is created, with the colors combining to form all the possible colors perceivable by human vision. The result is a variety of red-green-blue or “RGB” composite imagery , which can highlight atmospheric and surface features that are difficult or more time-consuming to distinguish from single-channel images alone. RGBs provide critical information that gives forecasters situational awareness and helps them understand rapidly changing weather. Often, geographical details like country and state boundaries are added to imagery to help orient the viewer.
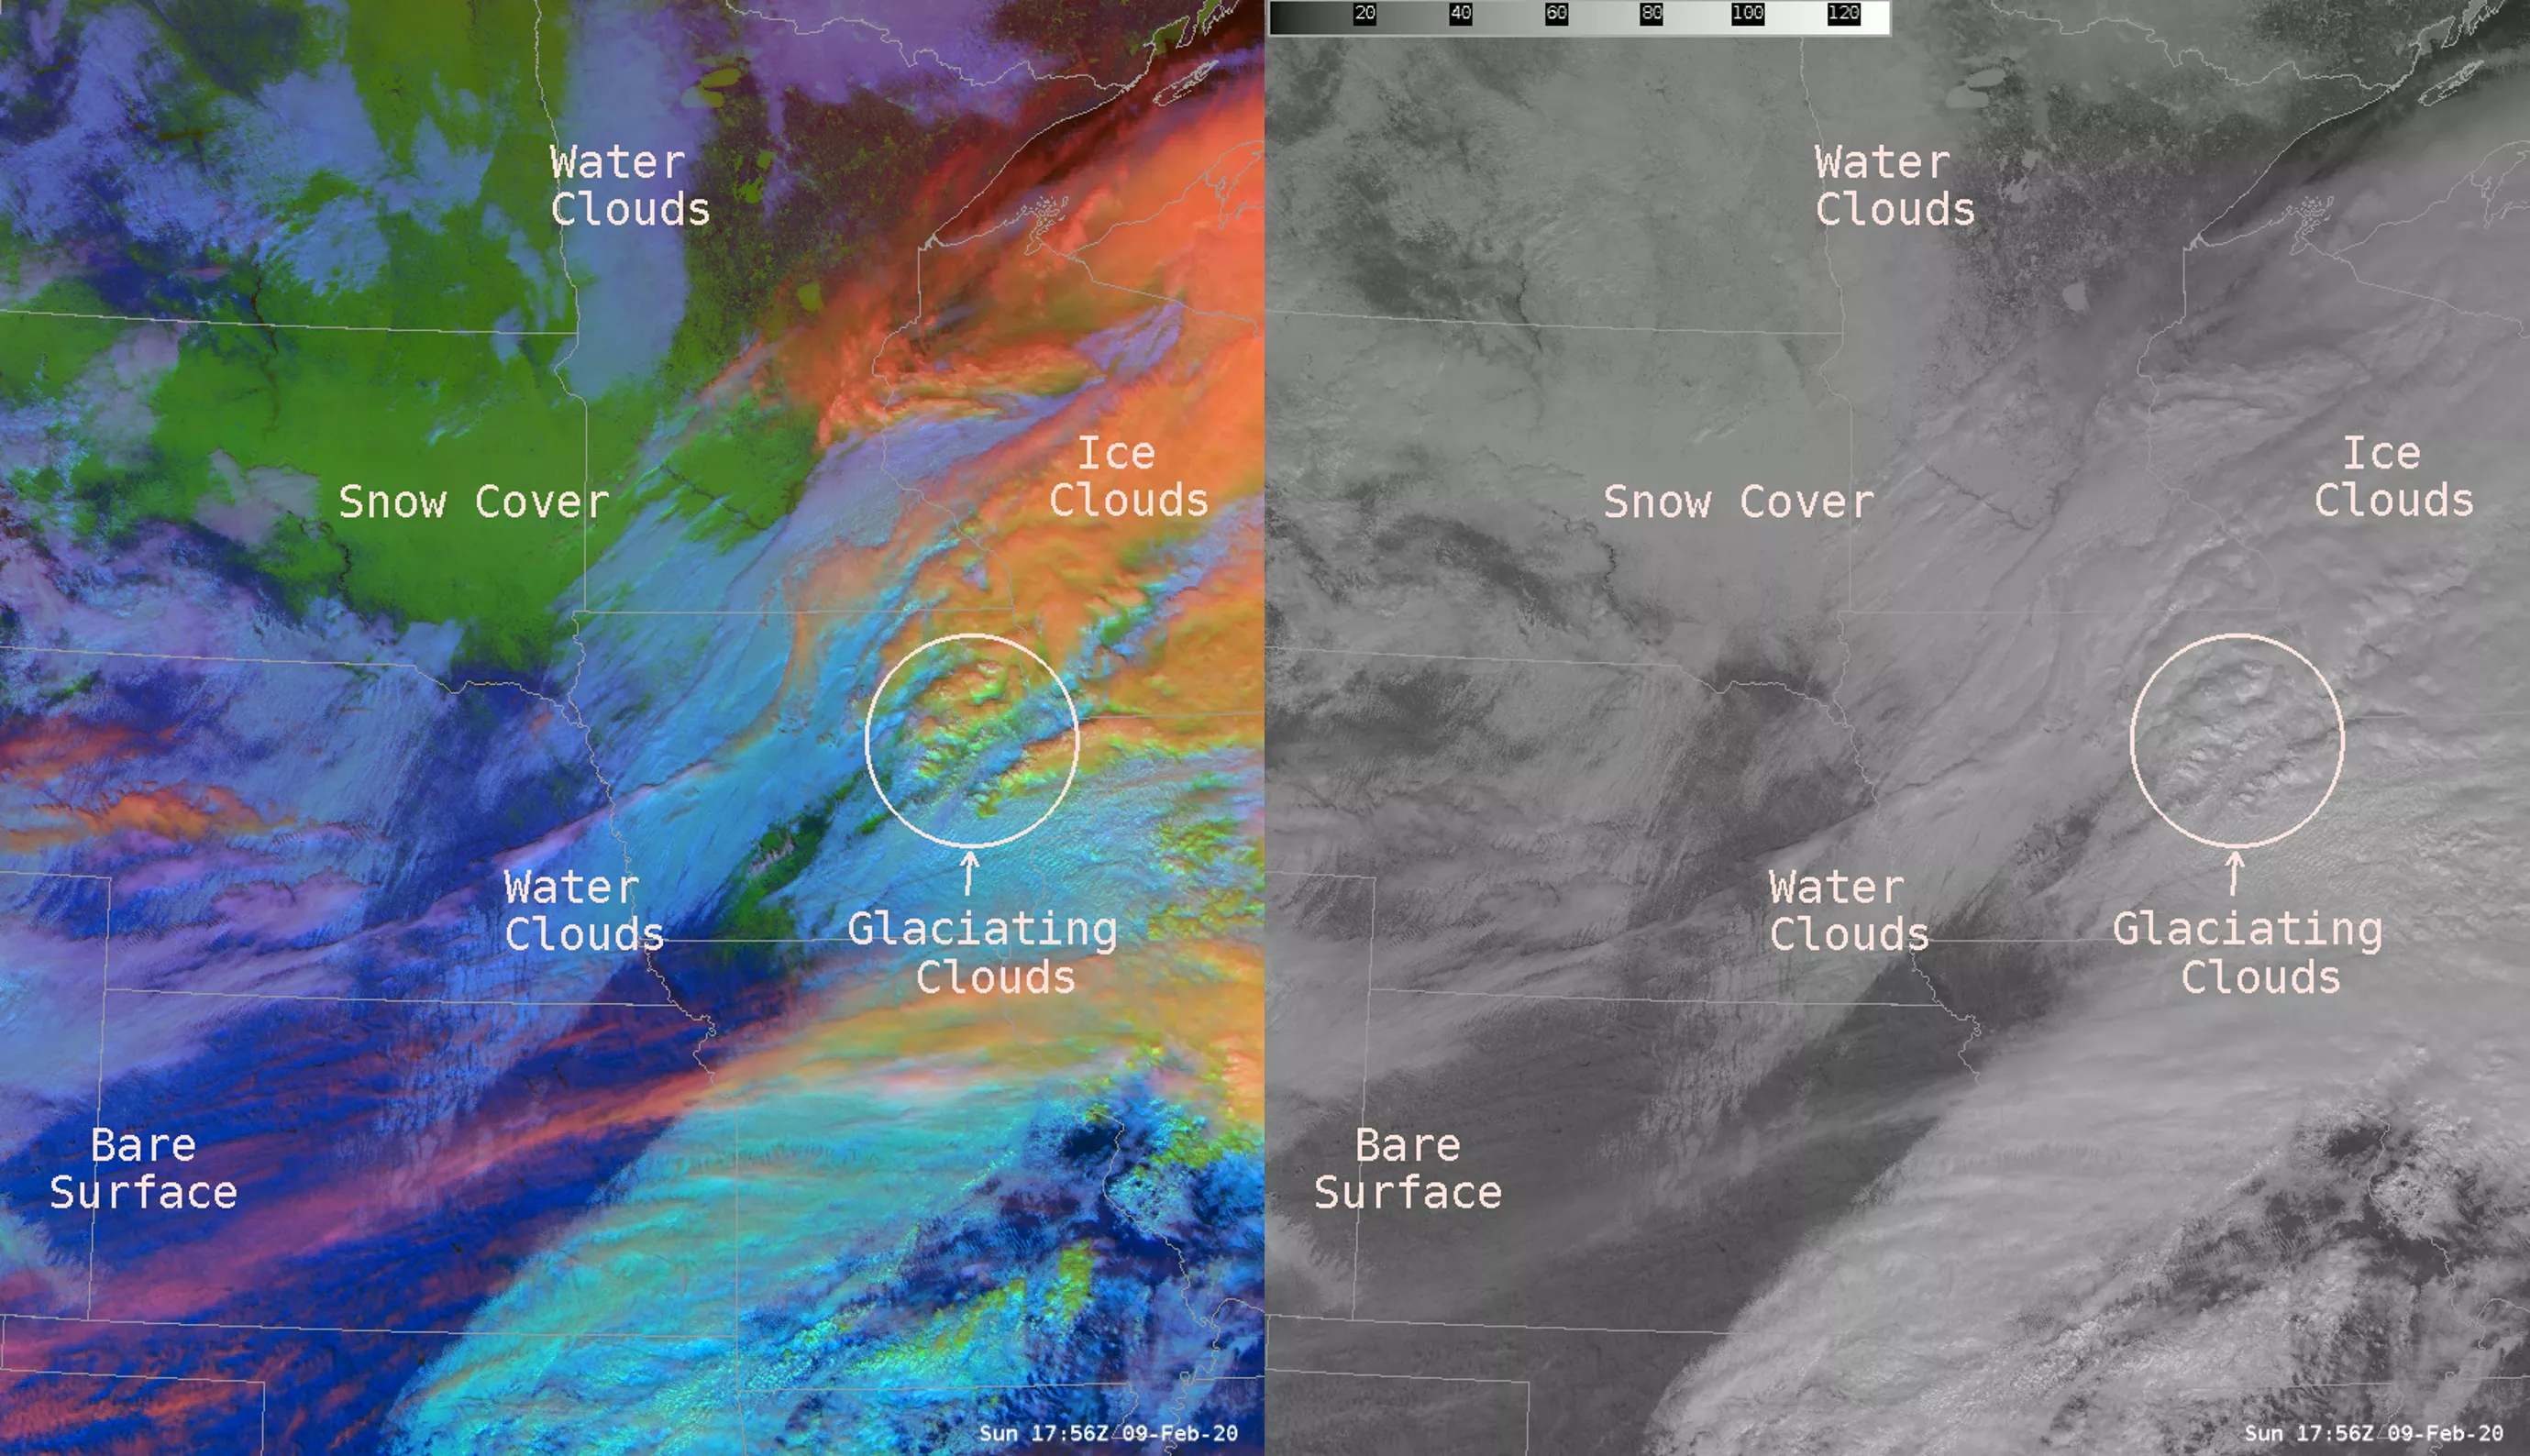
“By analyzing RGB composite imagery, forecasters can diagnose atmospheric features and processes that are not as readily apparent in the single-band imagery alone,” explained NOAA physical scientist Bill Line. “Further, a single RGB product may allow for the interpretation of multiple phenomena that would otherwise require the use of several imagery channels or products. The RGB imagery, therefore, allows forecasters to produce more accurate and timely forecasts and warnings for the public,” he said. “A few features that are more efficiently detected and tracked through the use of RGB imagery include convective initiation (the vertical transport of heat and moisture in the atmosphere, especially by updrafts and downdrafts in an unstable atmosphere), volcanic ash plumes, blowing dust, wildfire temperature trends, low clouds and fog, and snow cover.”
Looping the Images
A sequence of ABI images can be looped together to create an animation. Thanks to ABI’s rapid scanning capability, data can be collected for a specific area as often as every 30 seconds. This gives forecasters the ability to view a weather event as it happens and track an area of developing storms in near real-time. Knowing how fast storm clouds are forming can help forecasters with their severe storm watches and warnings. ABI also provides critical data during radar outages or in areas where radar coverage is sparse.
According to National Hurricane Center meteorologist Stephanie Stevenson, “The atmosphere is a fluid, so animating satellite imagery helps one understand how the fluid is moving and evolving. Forecasters can identify motions and cloud formations at various heights in the atmosphere to better predict where new storms might form or what direction existing storms are moving. The capability of rapid scan imagery provides an additional benefit of seeing the features evolve on a finer time scale. Severe weather outbreaks can develop quickly and animating 30-second imagery can help increase forecaster warning lead times.” Rapid scan imagery can also help accurately locate the center of tropical cyclones, particularly in weaker systems when the circulation center may be difficult to identify with less frequent imagery.
Not Just a Pretty Picture
A lot goes on behind the scenes to create and deliver this colorful imagery, but these enhancements result in more than just a pretty picture. This vivid imagery conveys complex environmental information from large satellite datasets to highlight the presence and evolution of important meteorological phenomena like fog, dust, fire hot spots and smoke, snow/ice, volcanic ash plumes, cloud properties, air mass temperature and moisture characteristics, and more. Adding color, combining data from multiple ABI channels, and looping the images provide critical information to help meteorologists quickly discern the information they need to issue timely forecasts and warnings.