
GOES satellites are known for providing critical data to weather forecasters, but the information they collect can also help the renewable energy sector. The detailed data GOES-16 (GOES-East) and GOES-17 (GOES-West) provide about clouds is useful for forecasting solar energy production.
Solar Energy and the Role of Clouds
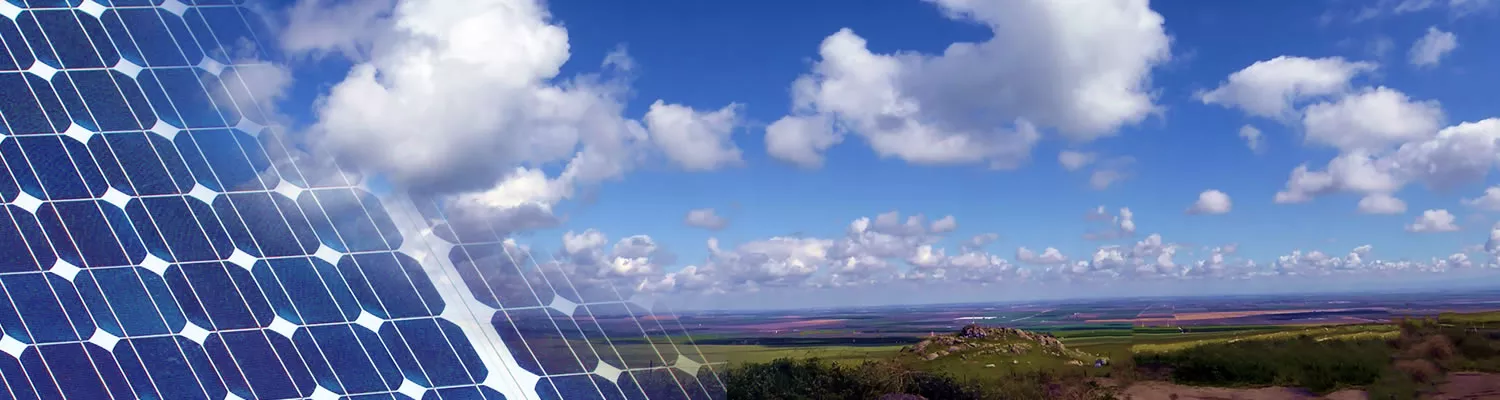
Solar radiation, or the electromagnetic energy emitted by the sun, can be captured and converted into useful forms of energy such as heat and electricity. Solar energy is the most abundant energy resource on Earth. According to the Department of Energy, the amount of sunlight that strikes Earth's surface in an hour and a half is enough to handle the entire world's energy consumption for a full year. Individual residences and businesses alike use solar panels to provide some or all of their energy needs. Utilities are also building solar plants to provide cleaner energy to their customers.
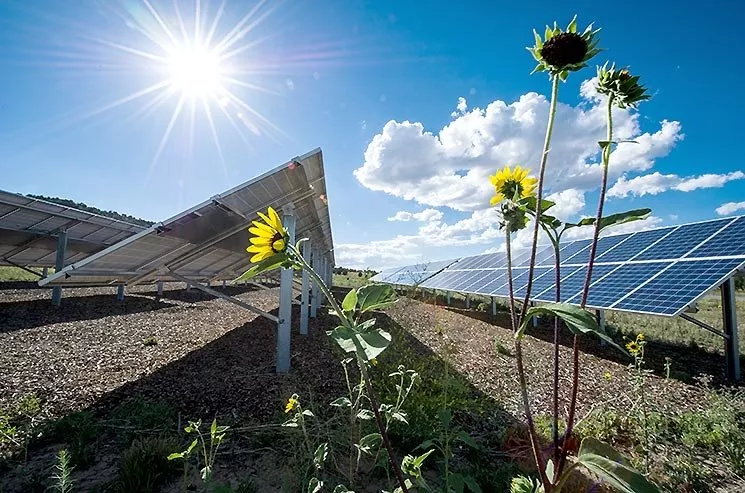
Solar farm. Credit: Department of Energy
Clouds play a key role in the transfer of energy through the atmosphere. Therefore, clouds affect the output of ground-based solar power generation systems. The amount of power these systems can produce is dependent on the level of light they receive, both directly from the sun and via light reflected from all parts of the sky in the hemisphere above.
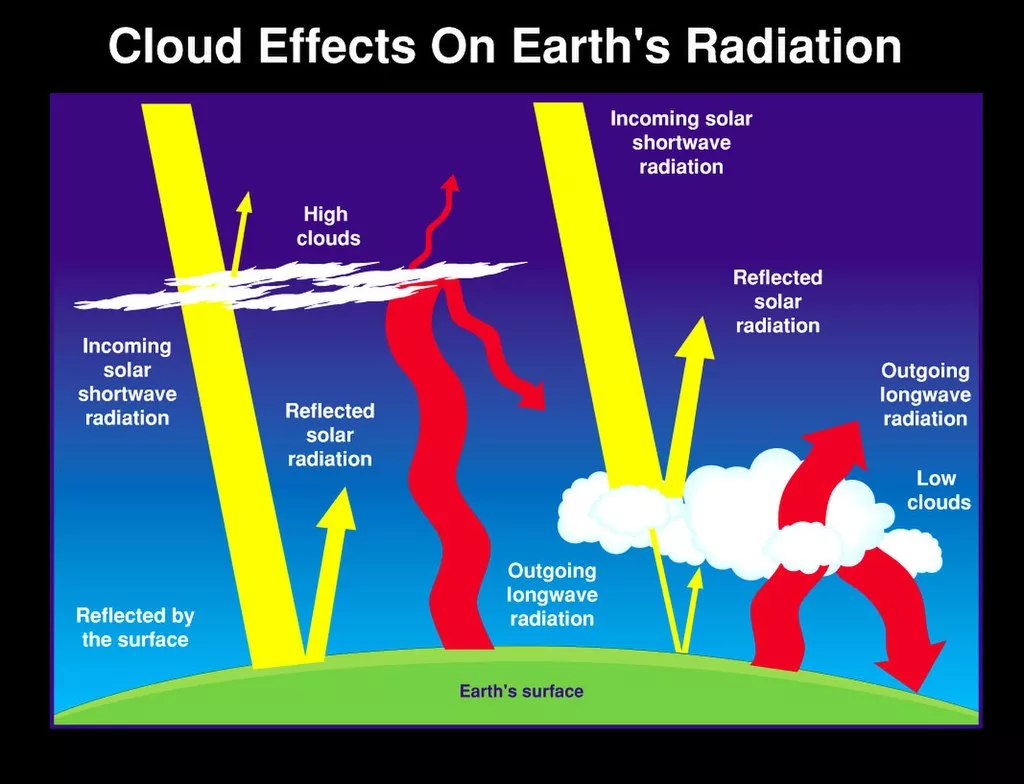
Low clouds reflect back to space much of the sunlight that falls on them, but have little effect on thermal energy emitted from Earth’ surface due to their similar temperature. High clouds reflect less sunlight energy but trap more of the thermal energy emitted by the surface. Credit: NASA Langley Research Center.
GOES Data for Solar Energy Applications
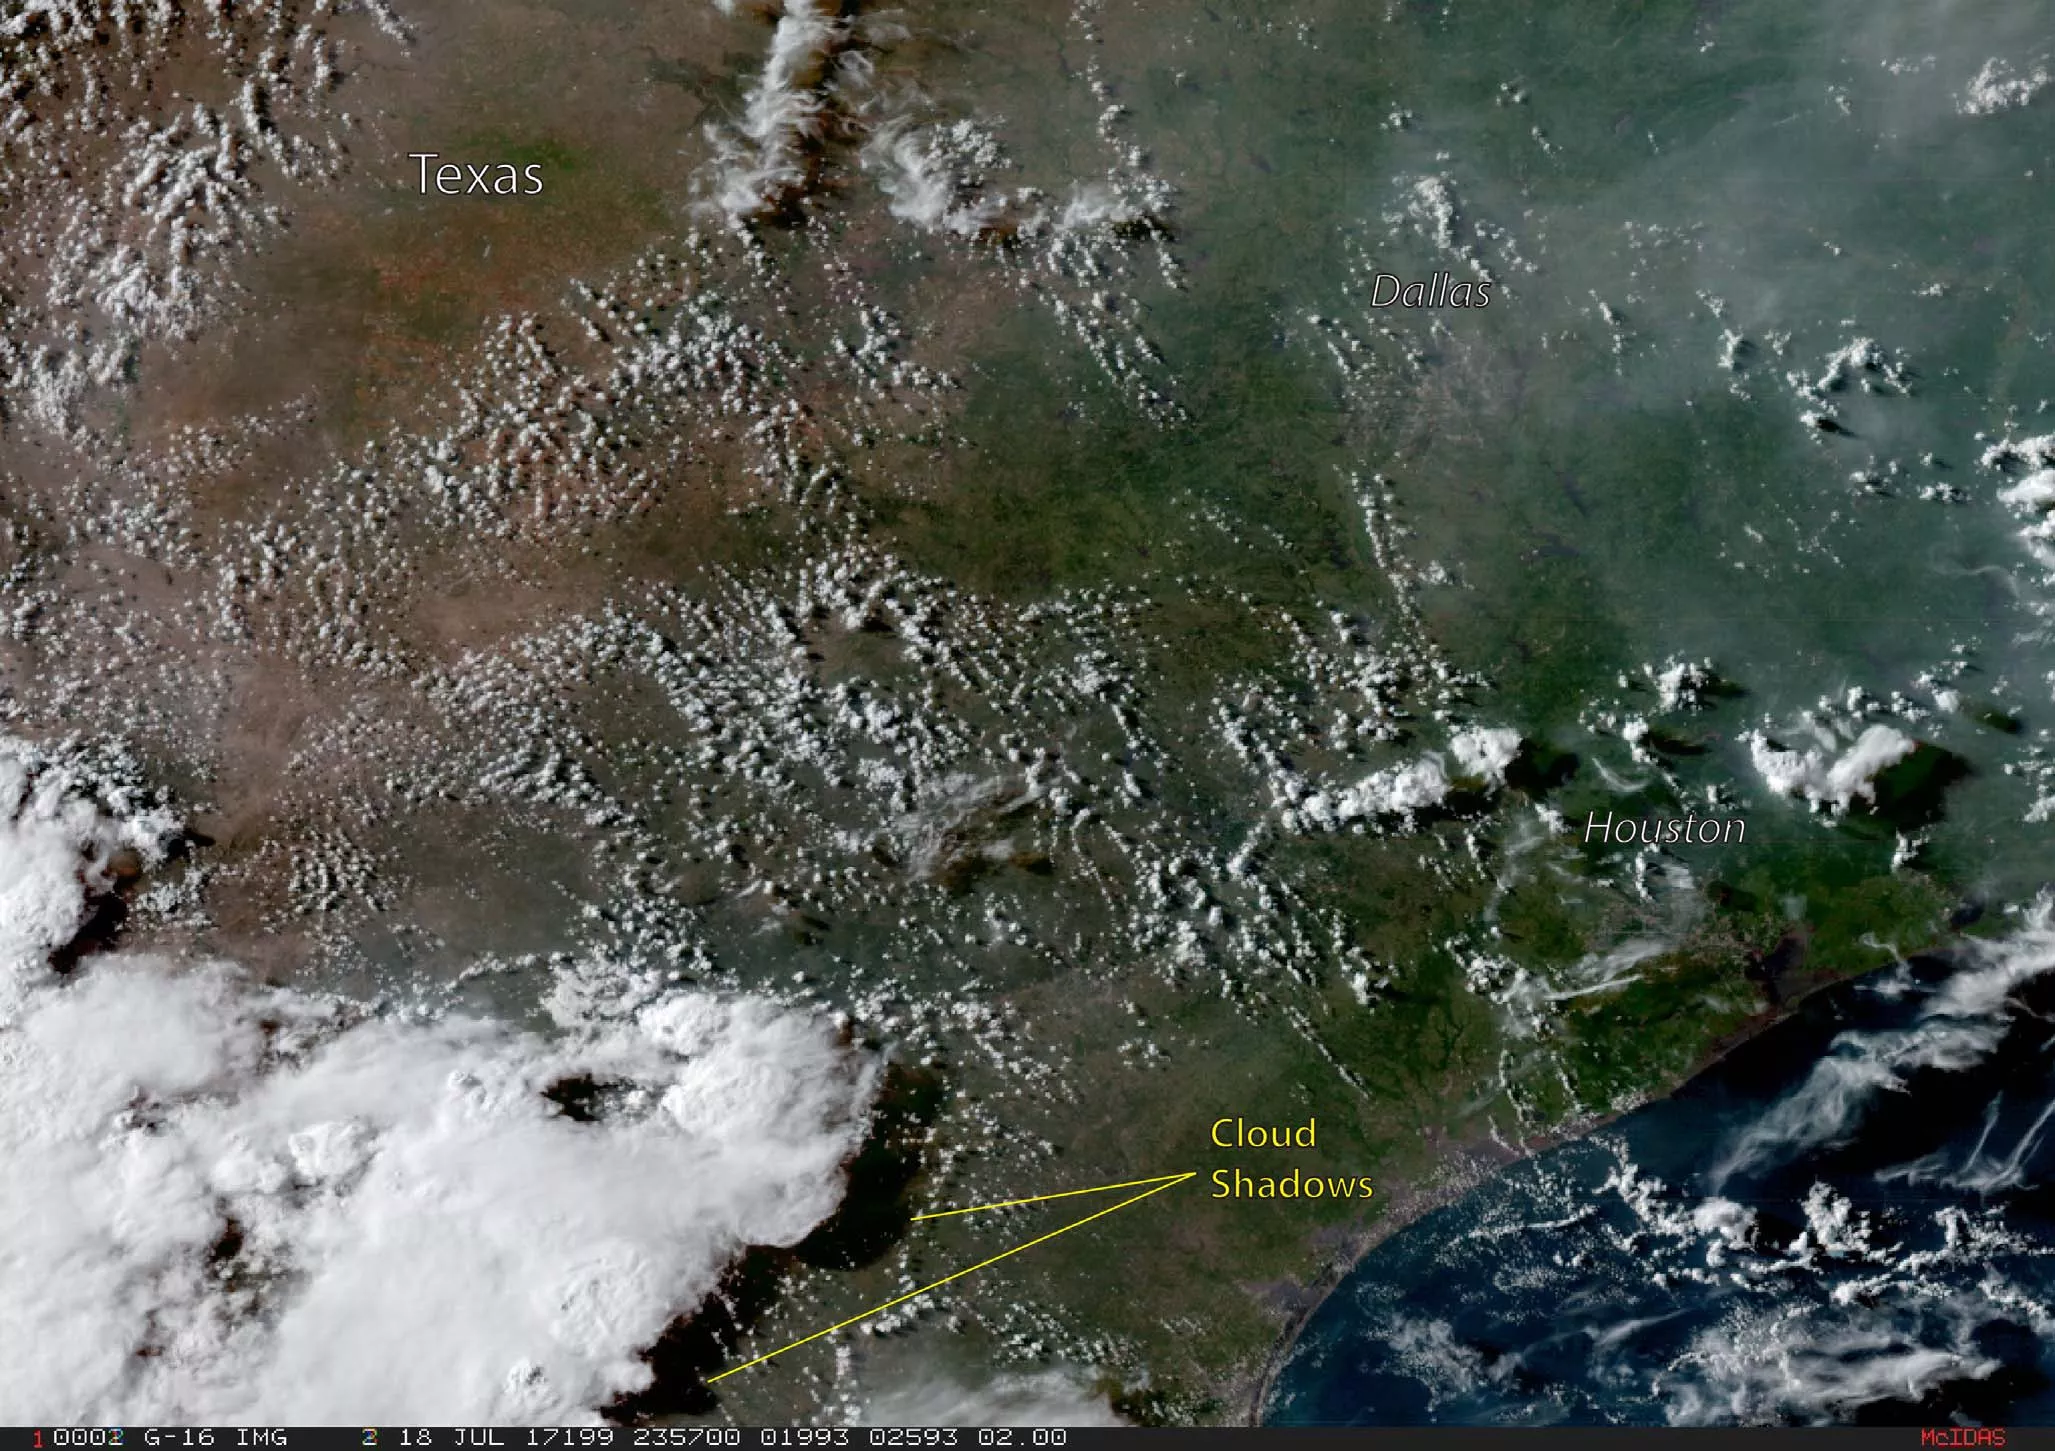
So how can the solar industry determine how much sunlight their systems will get, monitor efficiency, and maintain a balance between power generation and consumption? The view from 22,300 miles above can help. GOES-16 and GOES-17 constantly watch over the Western Hemisphere and provide properties at a much faster rate than previous GOES. This information can be used to track the motion of clouds, predict the passage of cloud shadows, and estimate the amount of sunlight reaching solar energy systems.
With solar energy becoming more widespread, there is a need for high-quality data for all phases of solar projects. From securing investor commitments and determining where to build and what technology to use to defining expected performance levels, and operating, maintaining and evaluating the efficiency of solar power generation systems, accurate data increases confidence.
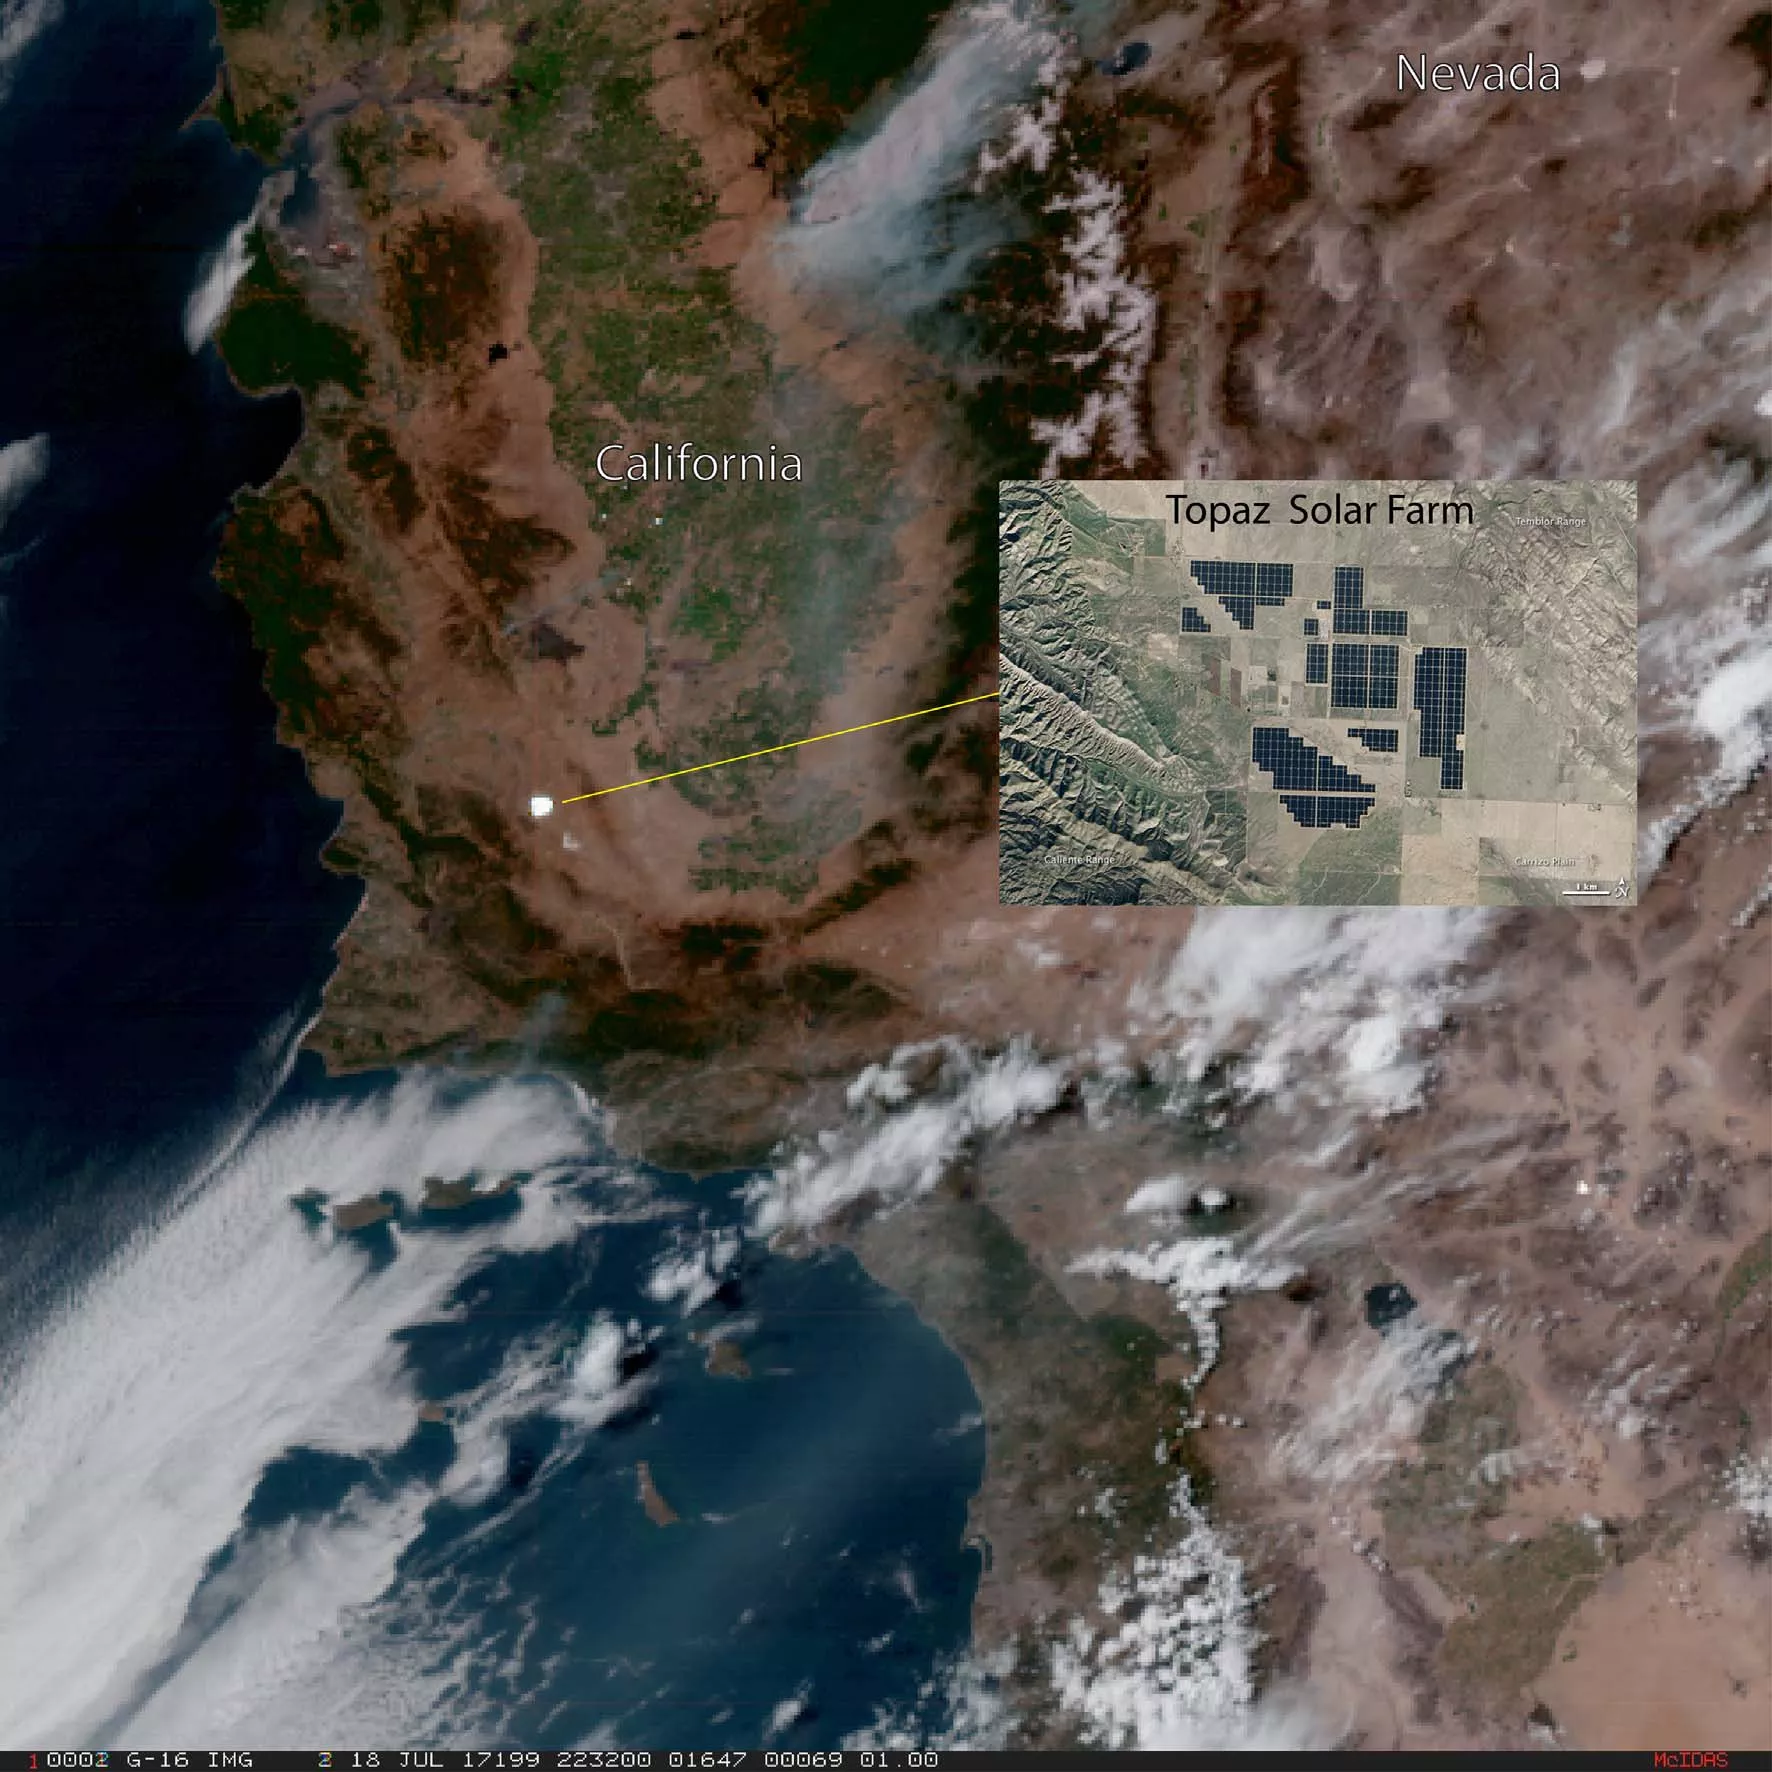
GOES-16 true color imagery over California collected on July 18, 2017 shows the reflection of sunlight off solar panels at the Topaz Solar Farm (inset) seen in the bright white patch noted in the imagery. Credit: CIRA
Planning Future Solar Energy Projects
GOES-16 and GOES-17 cloud products are generated daily for the Department of Energy (DOE)/ National Renewable Energy Laboratory (NREL) for solar energy applications. NREL collaborates with NOAA and scientists at the University of Wisconsin to acquire GOES cloud properties data, which are used to produce the National Solar Radiation Data Base (NSRDB). “This public database provides free historical solar radiation data,” said Manajit Sengupta, Chief Scientist of Sensing and Predictive Analytics at NREL. “We have over 60,000 users annually and are growing rapidly. This dataset is arguably the most used public solar radiation dataset in the world for renewable energy purposes. The data is used by nearly all solar plant developers in the U.S., Canada, Mexico, and Central and South America to assess resource needs while developing new projects.”
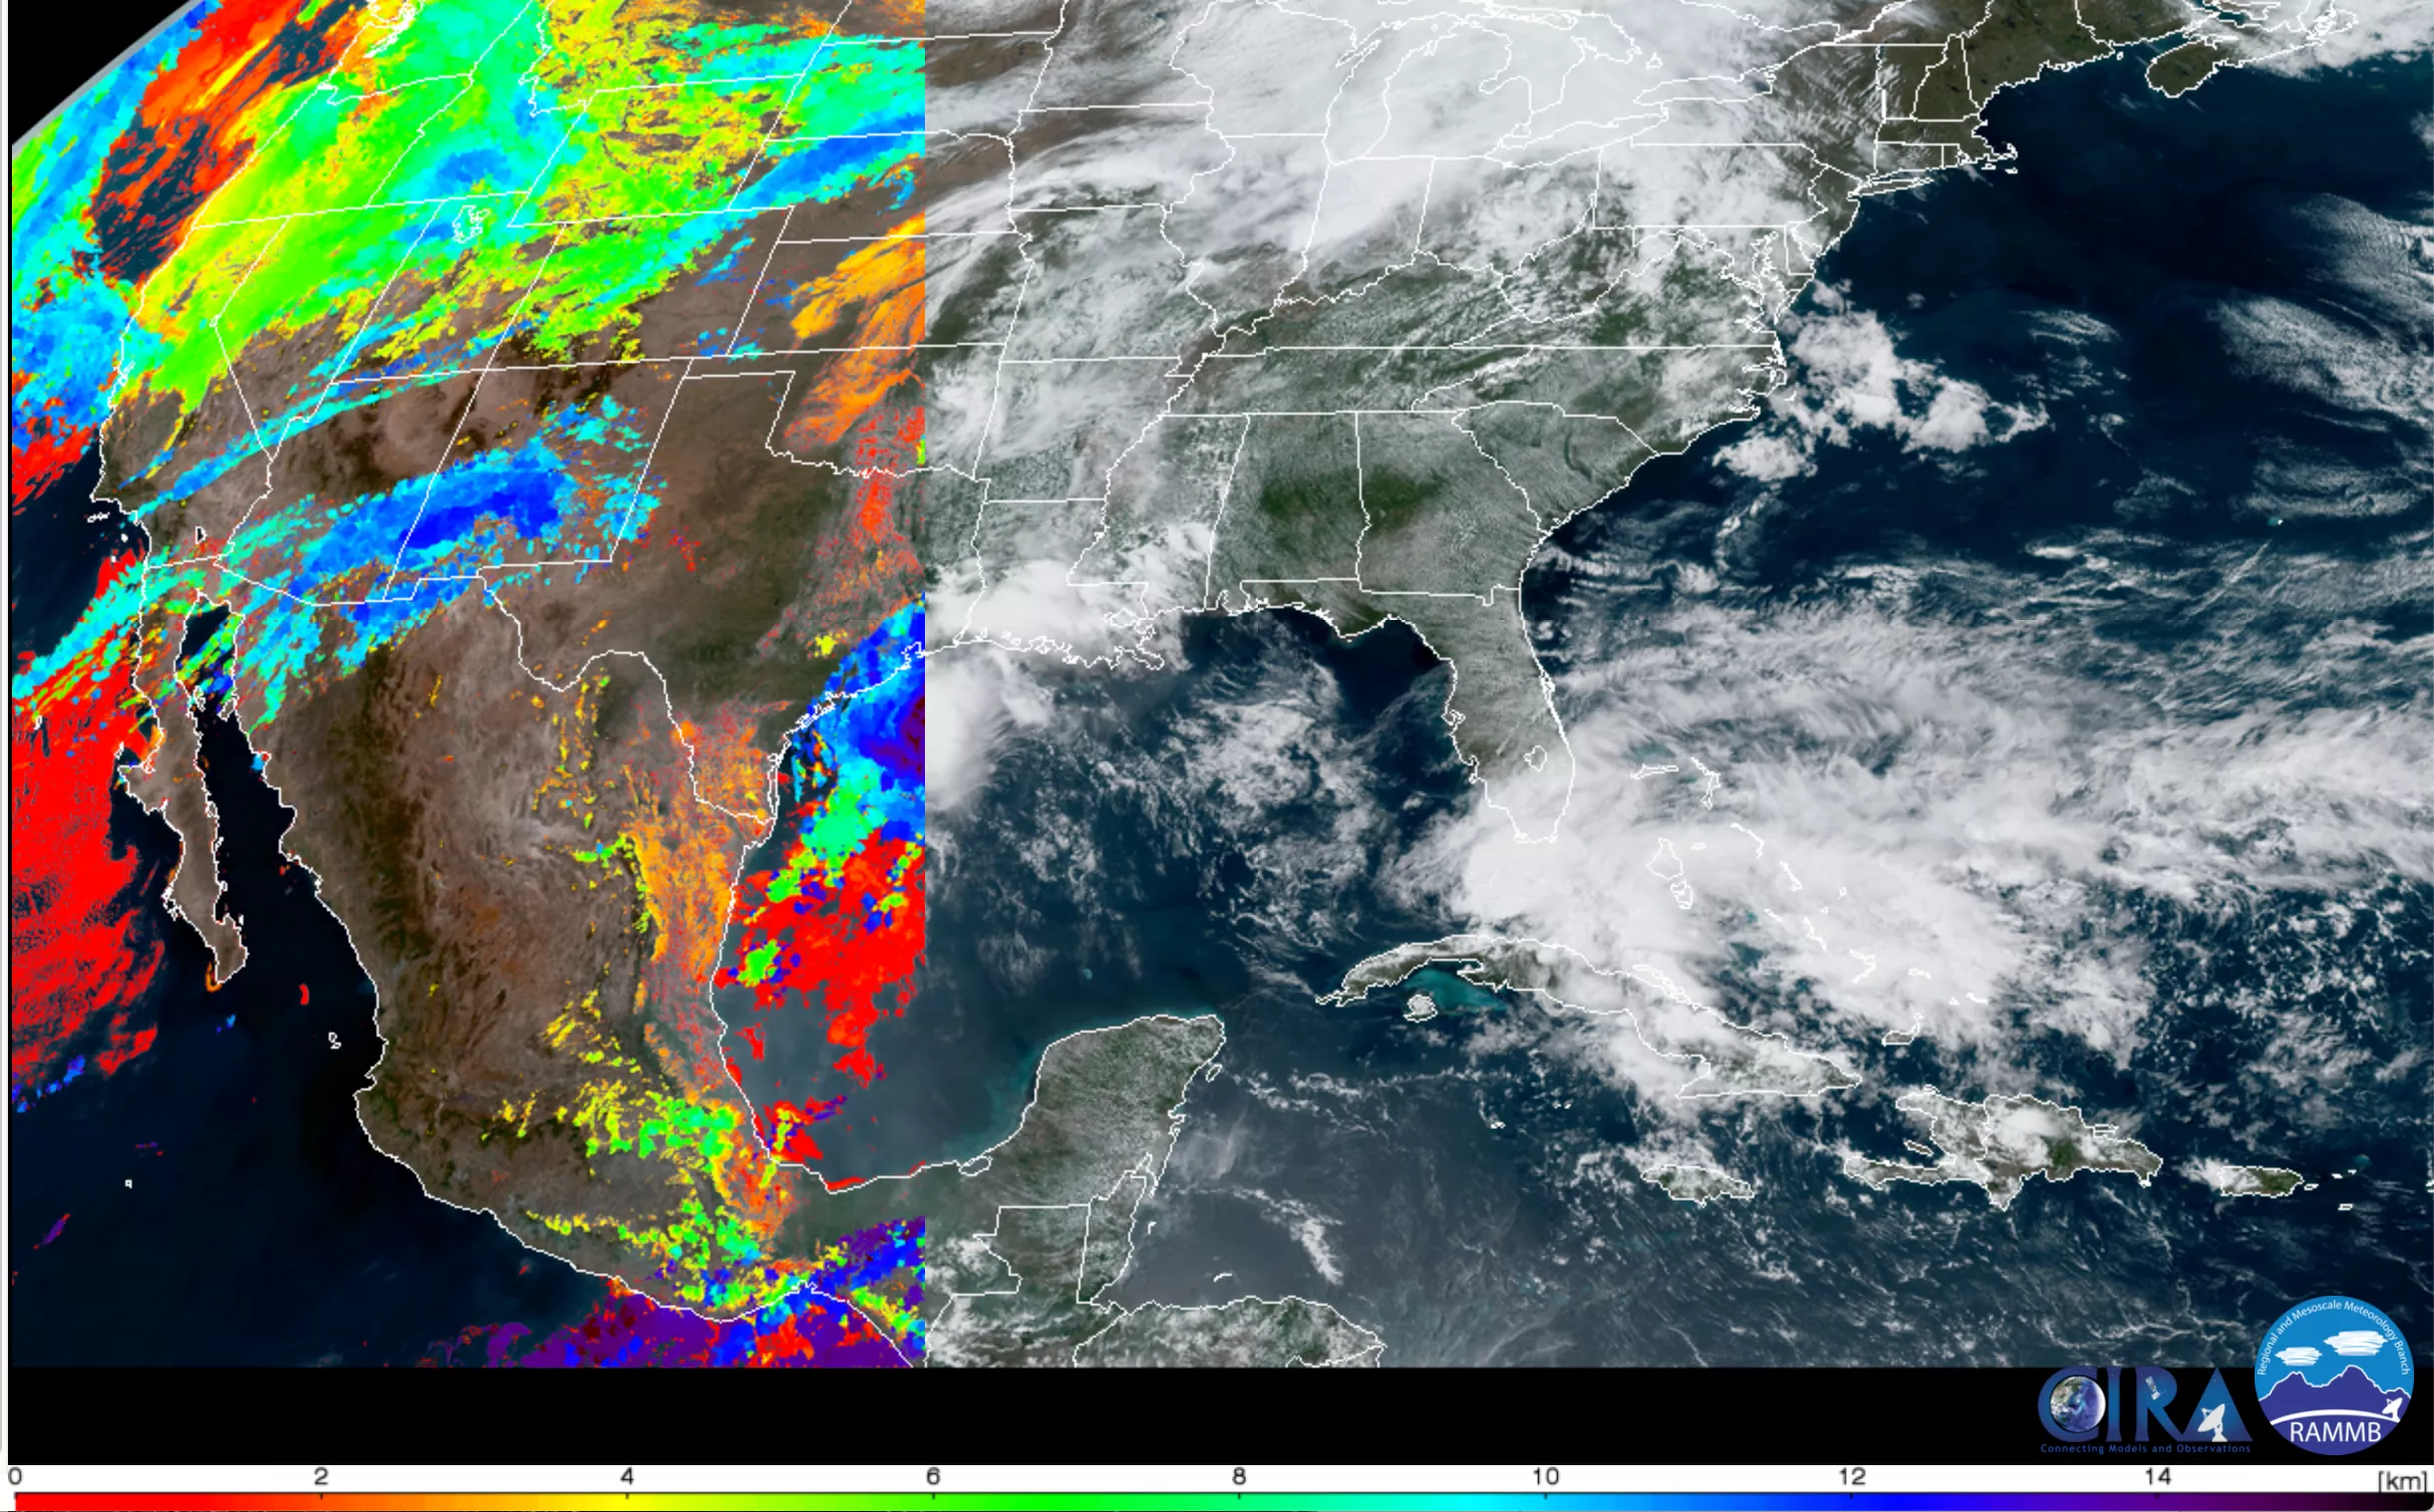
GOES-16 true color imagery over the Continental U.S. on 14 May 2020 shows NOAA cloud top height retrievals (in km, color key at bottom of graphic) atop GeoColor imagery. Cloud top height information is useful for understanding the geometry of where these clouds will cast shadows upon solar farms. Credit: CIRA
Short-term Forecasting of Solar Energy Production
GOES-16 and GOES-17 data aren’t just useful for planning future solar energy projects. Commercial vendors are using the information the satellites provide about clouds to produce short-term (0-7 hour) forecasting of solar energy production. Geostationary satellites are particularly useful in the short-term prediction of solar radiation for renewable energy production. Because GOES-16 and GOES-17 constantly watch over the same area of Earth and provide frequent, high-resolution data, they can communicate what types of clouds are present, how they are distributed in the sky, how much shadow they are creating over solar farms, and where they will move next. This provides valuable information about the variations that can occur in power production in the next few minutes to hours. Optimizing solar energy production requires advanced knowledge of both the general likelihood and specific timing of both cloud cover and direct sunlight.
GOES cloud information can also be used to improve the starting point of numerical forecast models as well, through a process called data assimilation. Techniques for relating the observed clouds to characteristics of the environment such as temperature, moisture, vertical motion, and horizontal winds can help better inform models, leading to better cloud forecasts at multi-hour time scales, when the details of the currently observed cloud field will have changed significantly.
Balancing Energy Loads
The data provided by GOES satellites is also key to balancing the energy load on electrical grids. Grid managers need to accurately calculate how much electricity the grid needs to carry at any given time. They must maintain the critical balance between generation and consumption. Too much or too little power can damage the millions of electrical devices connected to the grid or even trigger a power outage.
Grid Resilience
GOES-16 and GOES-17 also help grid operators prepare for the effects of severe weather on the electrical grid. The satellites provide advanced warning of severe thunderstorms, flooding, hurricanes, and other environmental hazards and can track where storms are moving next.
They don’t just protect from hazardous weather on Earth. Space weather can also impact power grid performance. Space weather is caused by electromagnetic radiation and charged particles being released from solar storms. Eruptions from the sun can cause geomagnetic and solar radiation storms, which can disrupt power utilities. GOES-16 and GOES-17 are equipped with a suite of sophisticated space weather instruments that provide early detection of approaching space weather hazards.
These observations help increase grid resilience. Predicting severe weather events on Earth and approaching space weather hazards in advance helps utilities better prepare and minimize impact to critical infrastructure.
Cloud Lensing and Broken Cloud Fields
Certain cloudy conditions can actually increase the amount of light reaching solar power generation systems. On the afternoon of April 22, 2020, GOES-17 (GOES-West) viewed a large amount of stationary cloud cover over the San Francisco area. The frozen water molecules inside of high-altitude clouds refracted the sun’s light, which in turn caused brighter-than-normal conditions on the ground compared to the darker blue skies of a clear day. This phenomenon, which is called “cloud lensing,” is unusual, and typically lasts for a period of 5–10 minutes. However, this high power event lasted for four hours, between 12–4 p.m. PST.
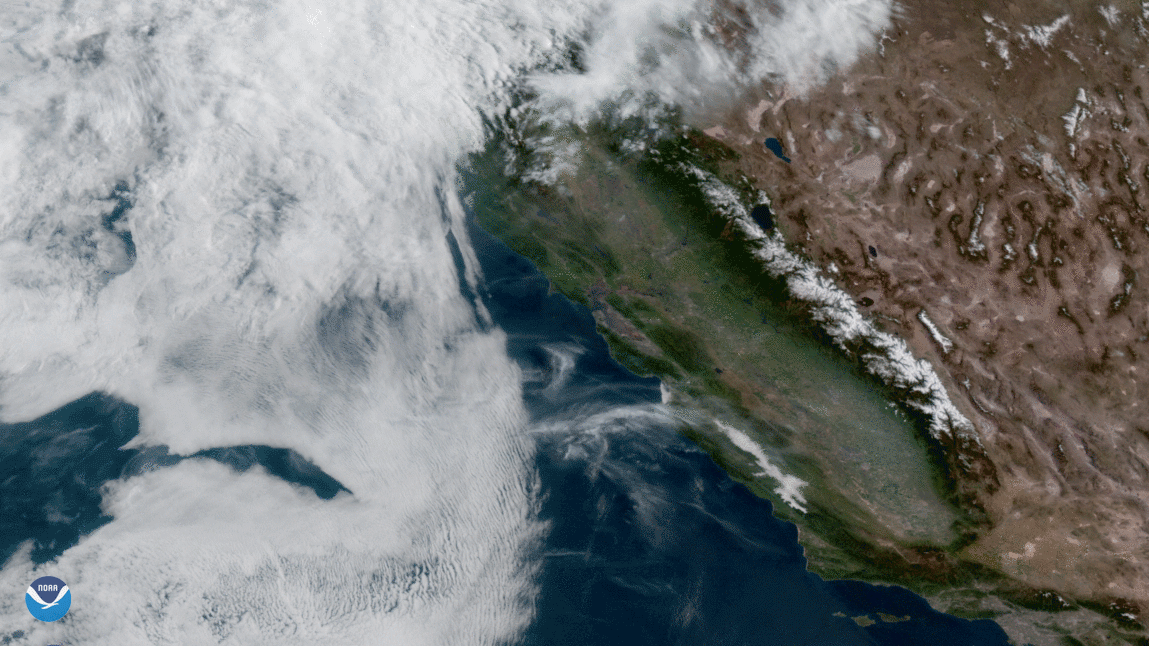
GOES-17 (GOES-West) imagery of a large amount of stationary cloud cover over the San Francisco area on April 22, 2020. Ice crystals within the heavy, stationary cloud cover refracted the afternoon sunlight, adding to the existing solar power, causing an abnormal energy surge on the ground.
More commonly, side illumination from broken cloud fields can also enhance solar power compared to clear days. “The three dimensional problem is an exciting topic of active research in solar energy,” said Steven Miller, a Senior Research Scientist at Colorado State University who collaborates with NOAA and NREL on satellite-based solar energy applications. “The Advanced Baseline Imager (ABI) instrument on the new generation of GOES satellites offers a lot more information, in much better detail, than past sensors. These improvements make it far more capable in terms of describing cloud characteristics and location, which determine the amount of sunlight reaching the surface.”
Critical Data for Harnessing Solar Energy
According to the Department of Energy, the amount of solar power installed in the U.S. increased more than 23 times from 2008 to 2015. As demand grows, the need for timely, detailed information about solar radiation and cloud cover is essential. From determining where to build new solar farms to dispatching energy at optimal times and balancing the load on electrical grids, GOES-16 and GOES-17 provide critical data for harnessing solar energy and efficiently delivering it to consumers.