
Ever wondered what makes the color composite imagery from GOES-16 is so much better than similar imagery from earlier GOES satellites? Here's your answer.
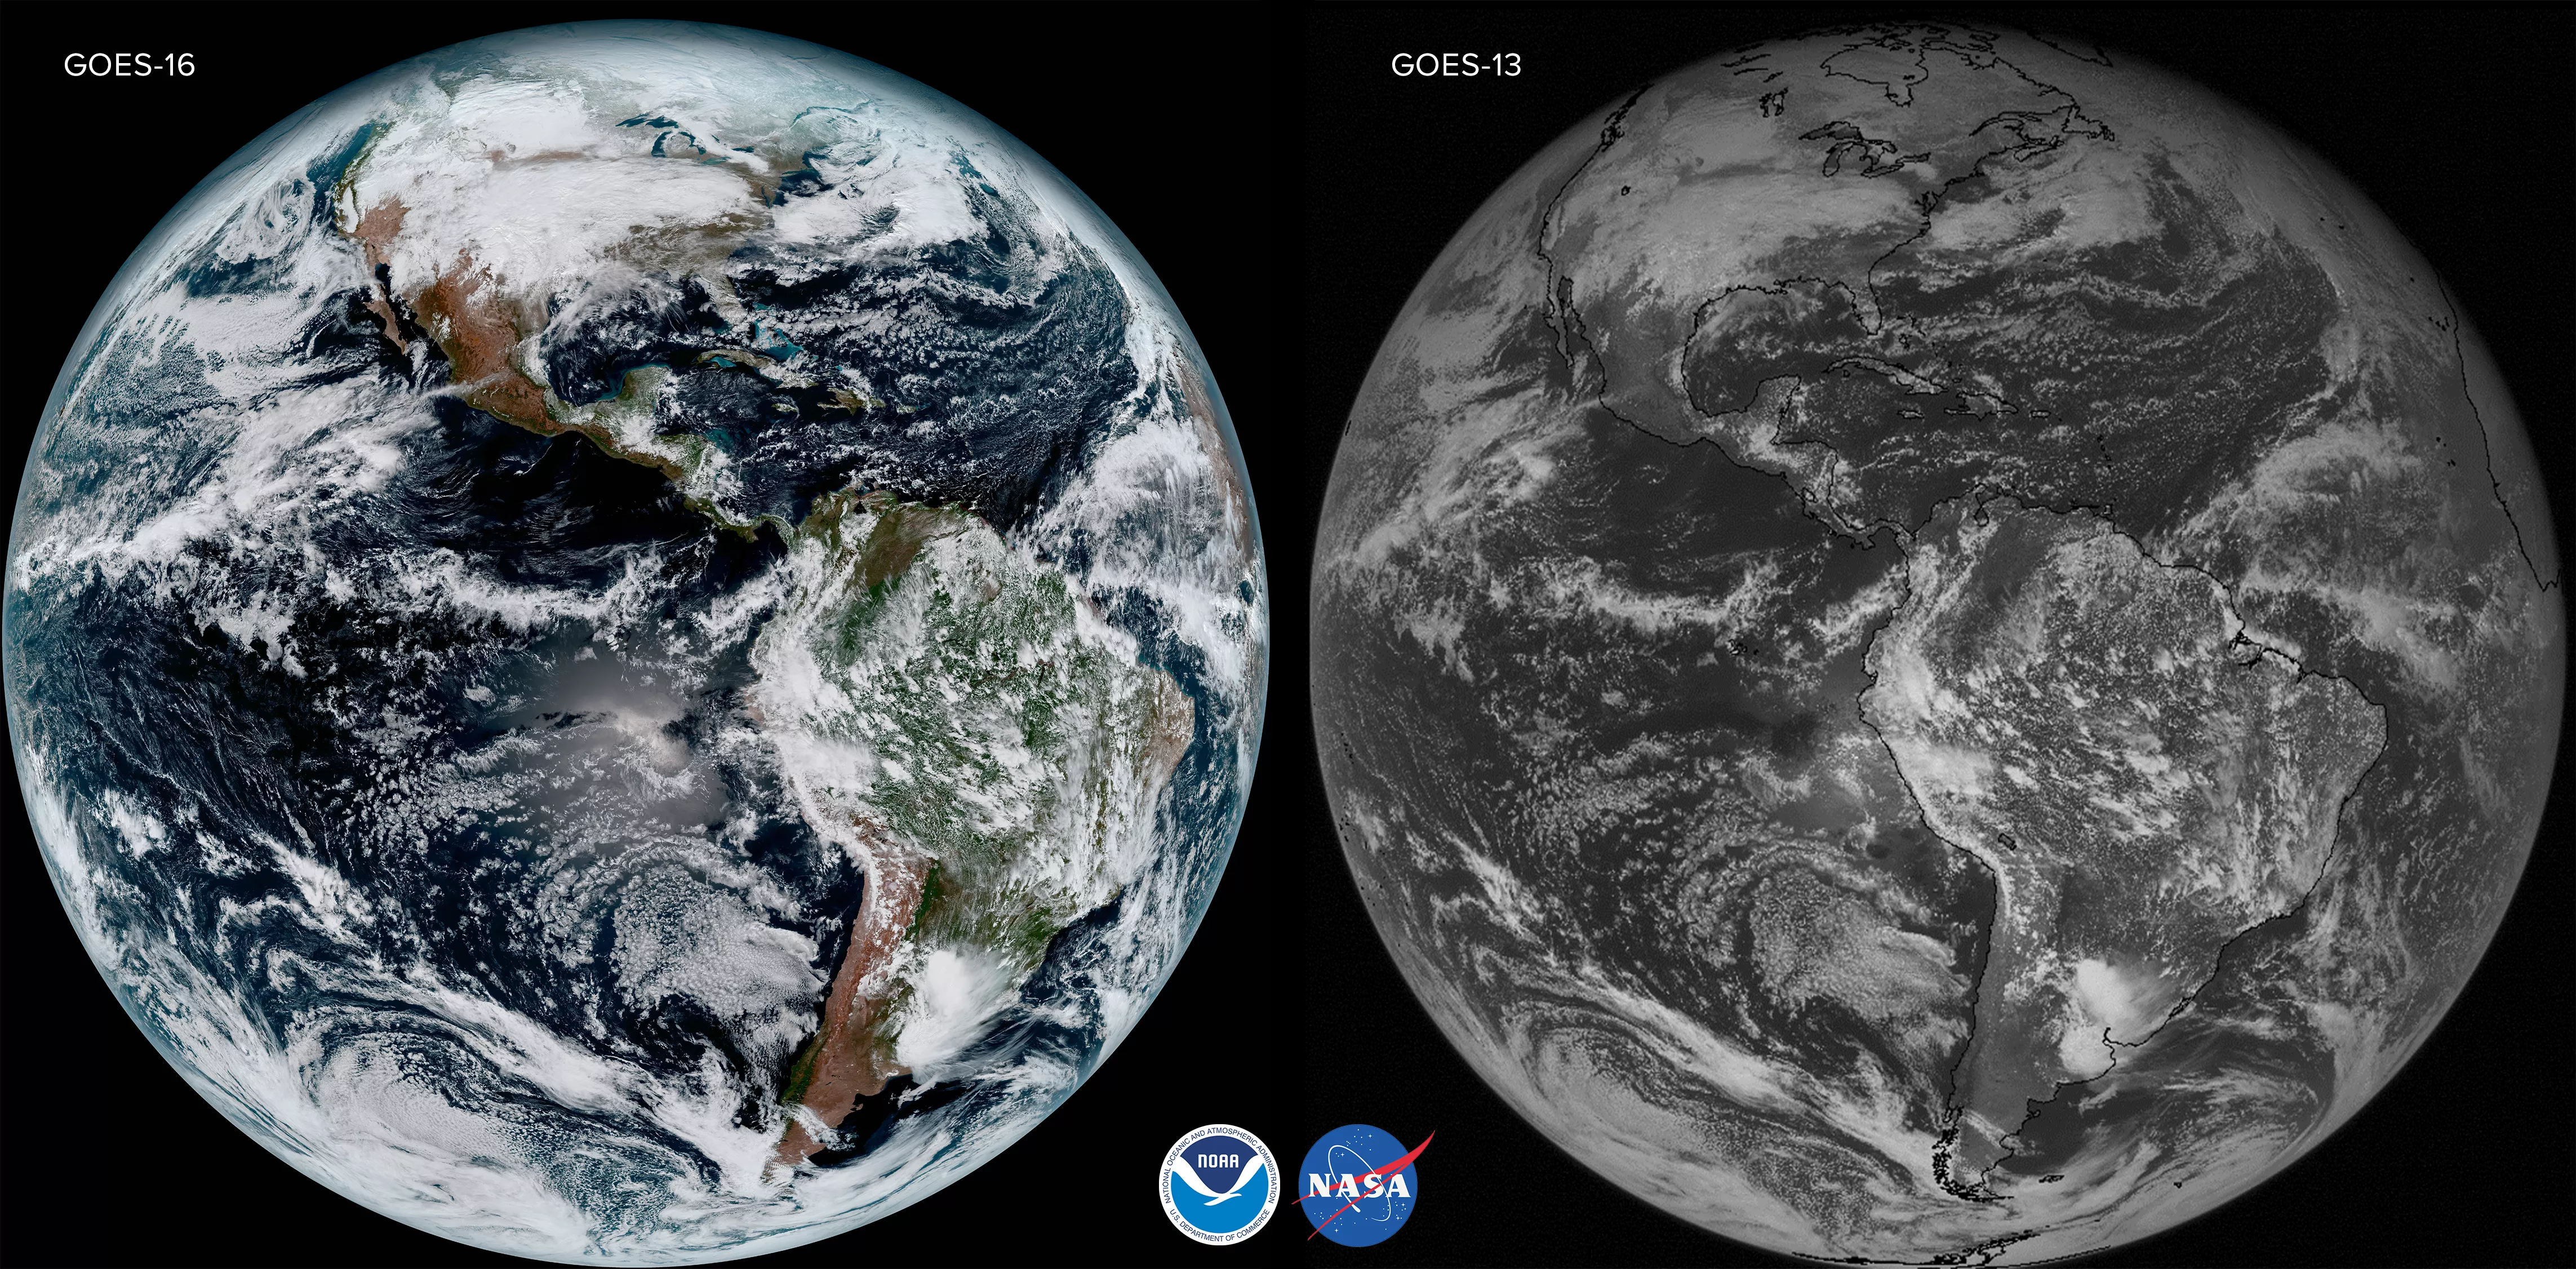
With five-times greater coverage, four-times the spatial resolution, and three-times the spectral channels than earlier generations of GOES satellites, GOES-16's Advanced Baseline Imager can provide more detailed imagery and multi-task in ways that its predecessors can not. For proof of that, consider the following image comparing full-disk images captured by two NOAA satellites -- GOES-16 and GOES-13 -- at the same time on the same day: 1:07 p.m. EST on January 15, 2017.
In the image above, on the left is a color-composite full-disk image from NOAA's newest geostationary weather satellite GOES-16 (located at 89.5 degrees West longitude), which was created by combining data from three of the ABI's 16 spectral channels. By comparison, the imager aboard GOES-13 has just five spectral channels, and their data cannot be combined to produce color composites with this "true-color" effect without the inclusion of additional data sets.
In addition to offering more channels, the ABI can provide a full disk image of the Earth every 15 minutes, one of the continental U.S. every five minutes, and has the ability to target regional areas where severe weather, hurricanes, wildfires, volcanic eruptions or other high-impact environmental phenomena are occurring as often as every 30 seconds.
With these enhanced capabilities, the ABI will help forecasters distinguish between differences in the atmosphere like clouds, water vapor, smoke, ice and volcanic ash. In doing so, it will extend the more than 40-year legacy of satellite observations from NOAA that the American public has come to rely upon.
But what about the full-disk color images from GOES-13 and -15 that NOAA has released in recent years? what makes composite color images from GOES-16 an improvement over them?
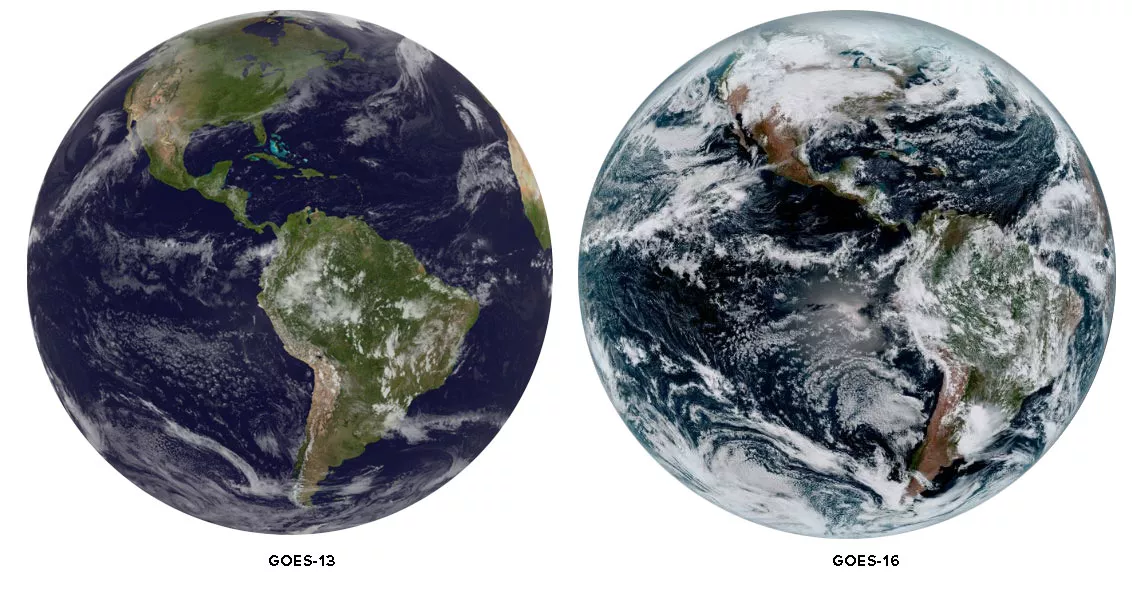
The answer has to do with the limited number of spectral bands (5) available from the imagers aboard GOES-13 and -15, the current GOES East and West satellites. Current GOES imagery with colors is almost always created by taking a single infrared image and overlaying it on top of a colored terrain and/or ocean map (i.e., maps from other sources, such as NASA's blue marble data set) to make a color image.
The composite color images from GOES-16, however, are created by combining data from three of the16-bands afforded by the satellite's Advanced Baseline Imager to produce a range of colors within visible part of the electromagnetic spectrum (think the colors of the rainbow, ROYGBIV). The end product is an image much closer to what a human eye would see from space.
Yet, as mesmerizing as GOES-16's color images are, the fact is that meteorologists don't always want to view the Earth and its atmosphere this way. This explains why GOES-16 carries an imager with 16 spectral bands as opposed to a camera. Far from being chosen at random, each one of the bands corresponds to a specific wavelength of light useful for seeing a particular feature of Earth's atmosphere and/or surface, such as the presence of water vapor in the high, mid, and low levels of the atmosphere; the location of different cloud types; areas of ice and snow; different bands of radiation; and so on.
Learn more about GOES-16 Advanced Baseline Imager on the GOES-R.gov website.
To see more GOES-16 imagery, see our image gallery.