
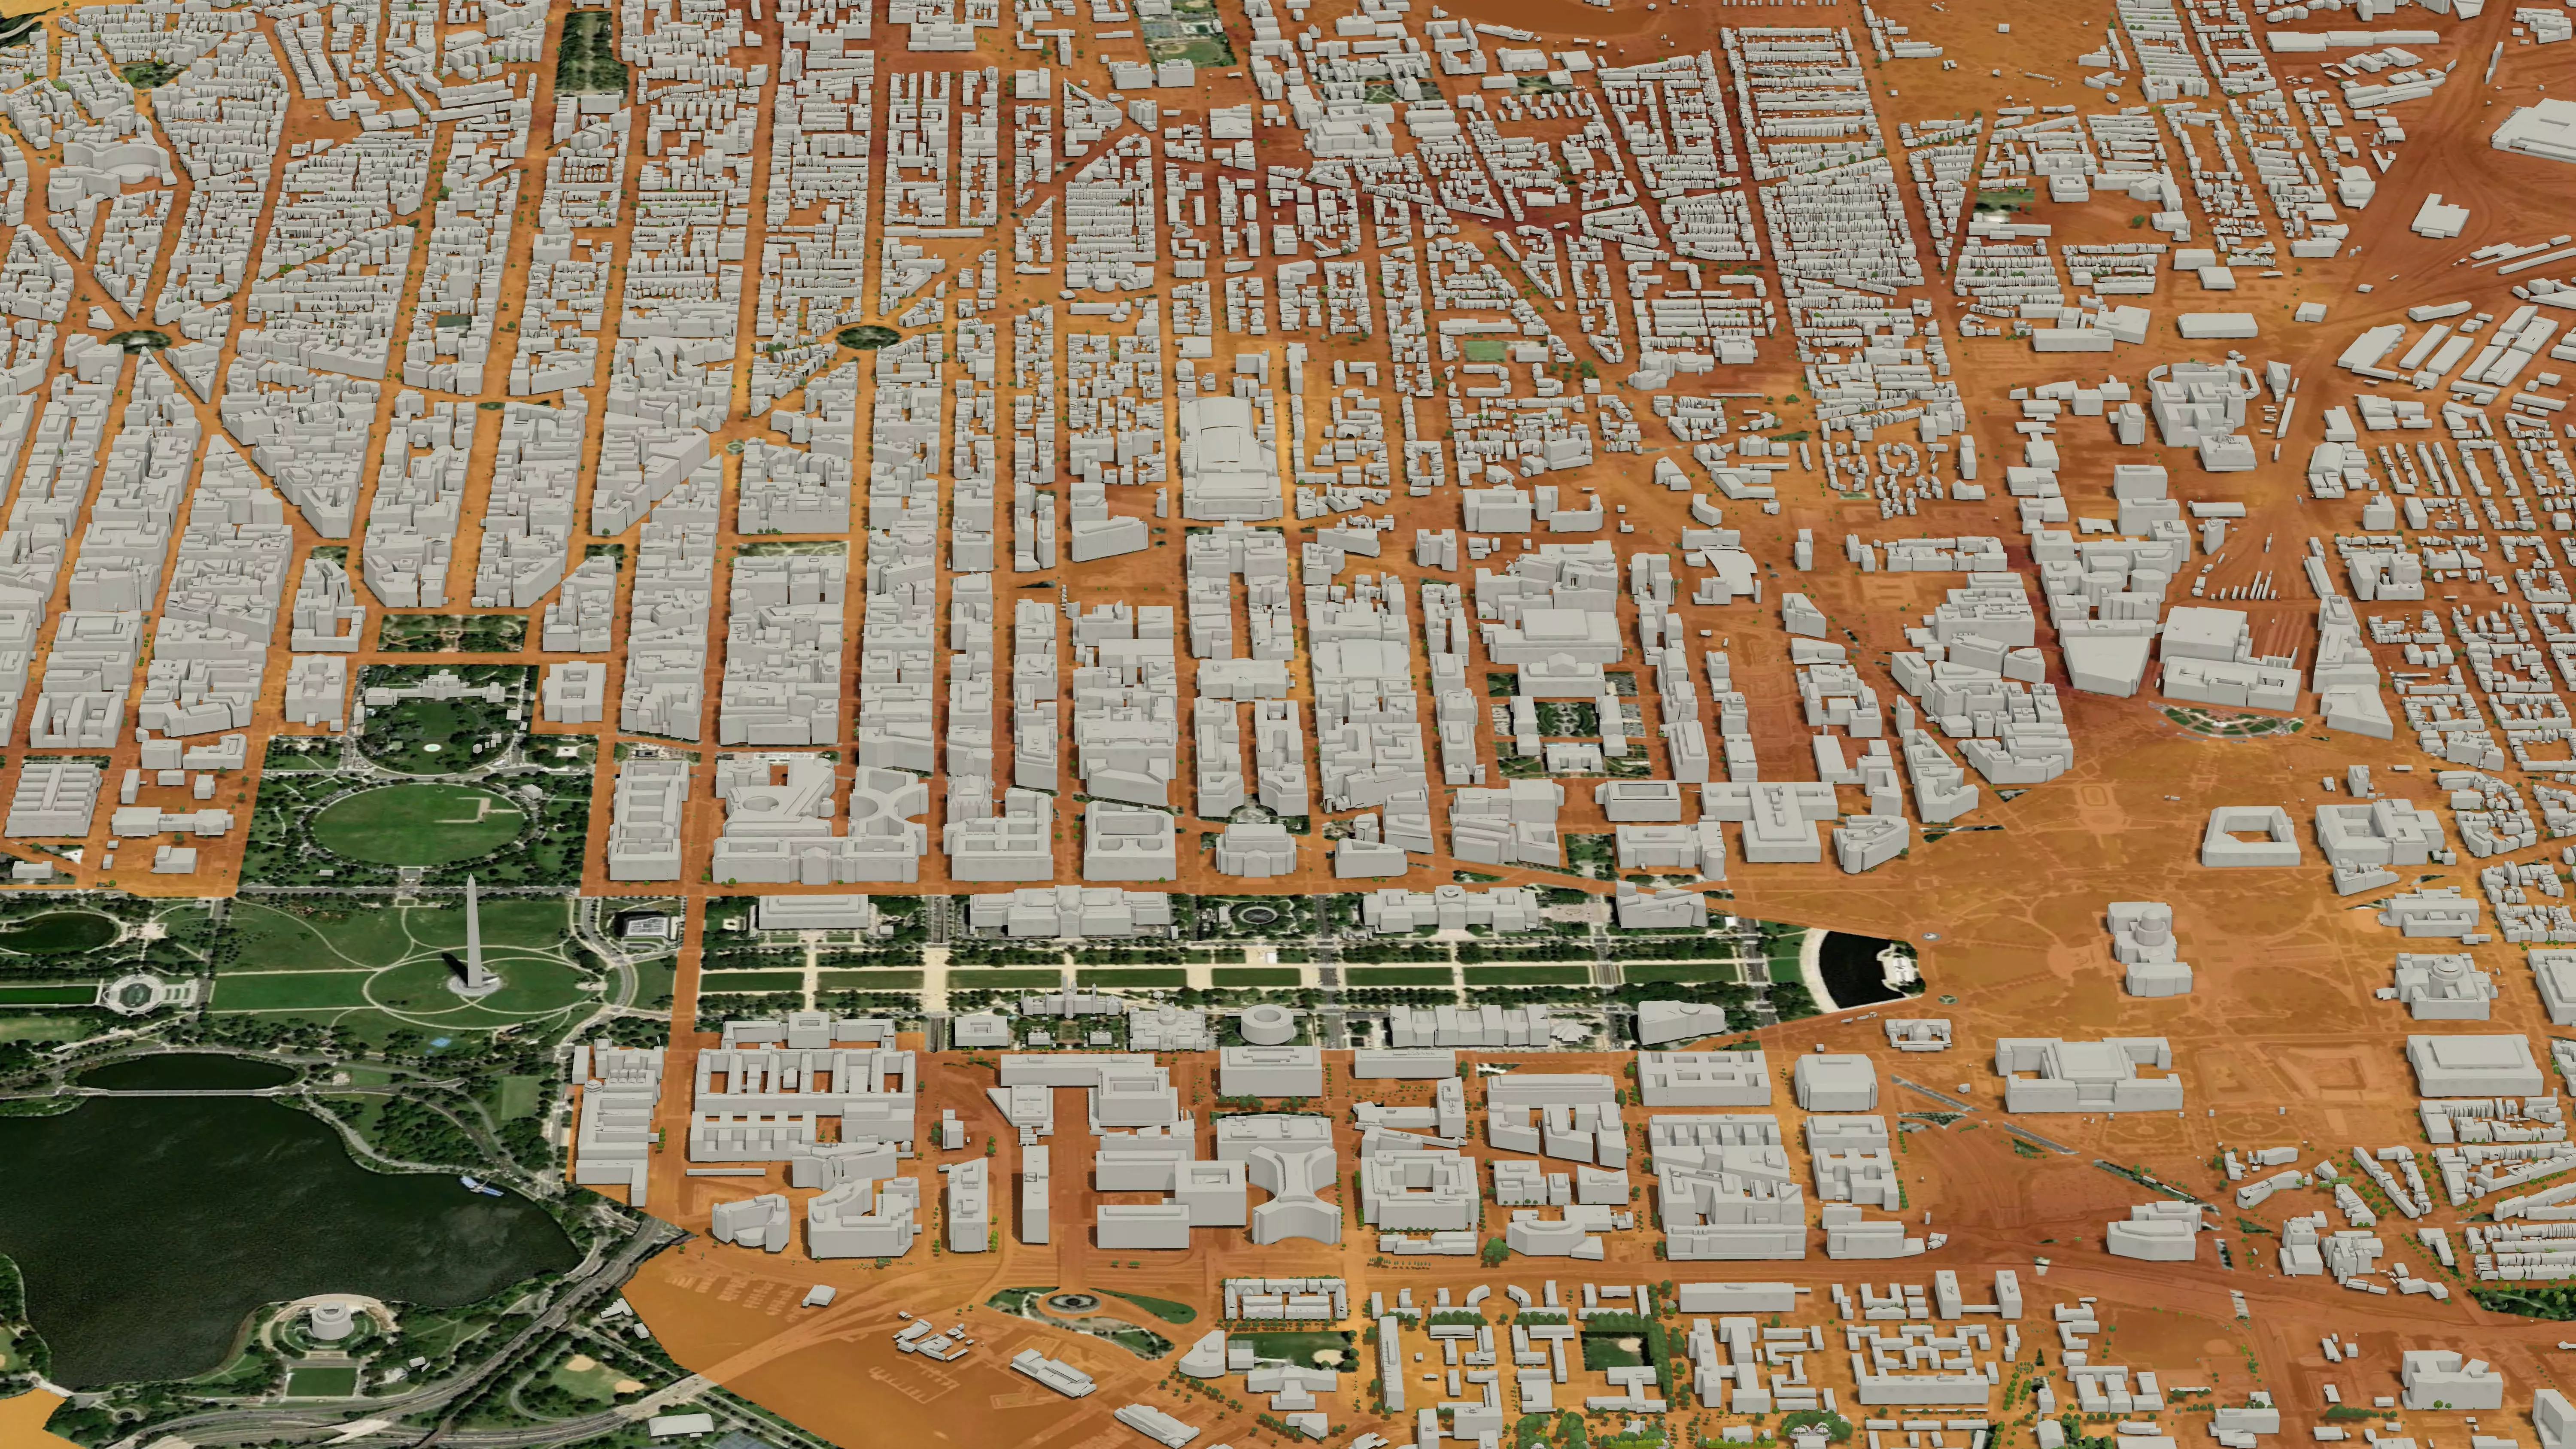
Three-dimensional map of heat distribution across Washington, D.C.
A custom heat island 3D rendering of the Washington, D.C. area shows the hottest and coolest parts of the city on a summer day. This image is generated using a machine-learning process which combines satellite imagery with measurements collected by volunteers on the ground. These NOAA-funded efforts help communities mitigate heat risk, and support heat planning, preparedness, and response.
Morgan Zabow, Community Heat and Health Program Manager, NOAA/OAR/Climate Program Office
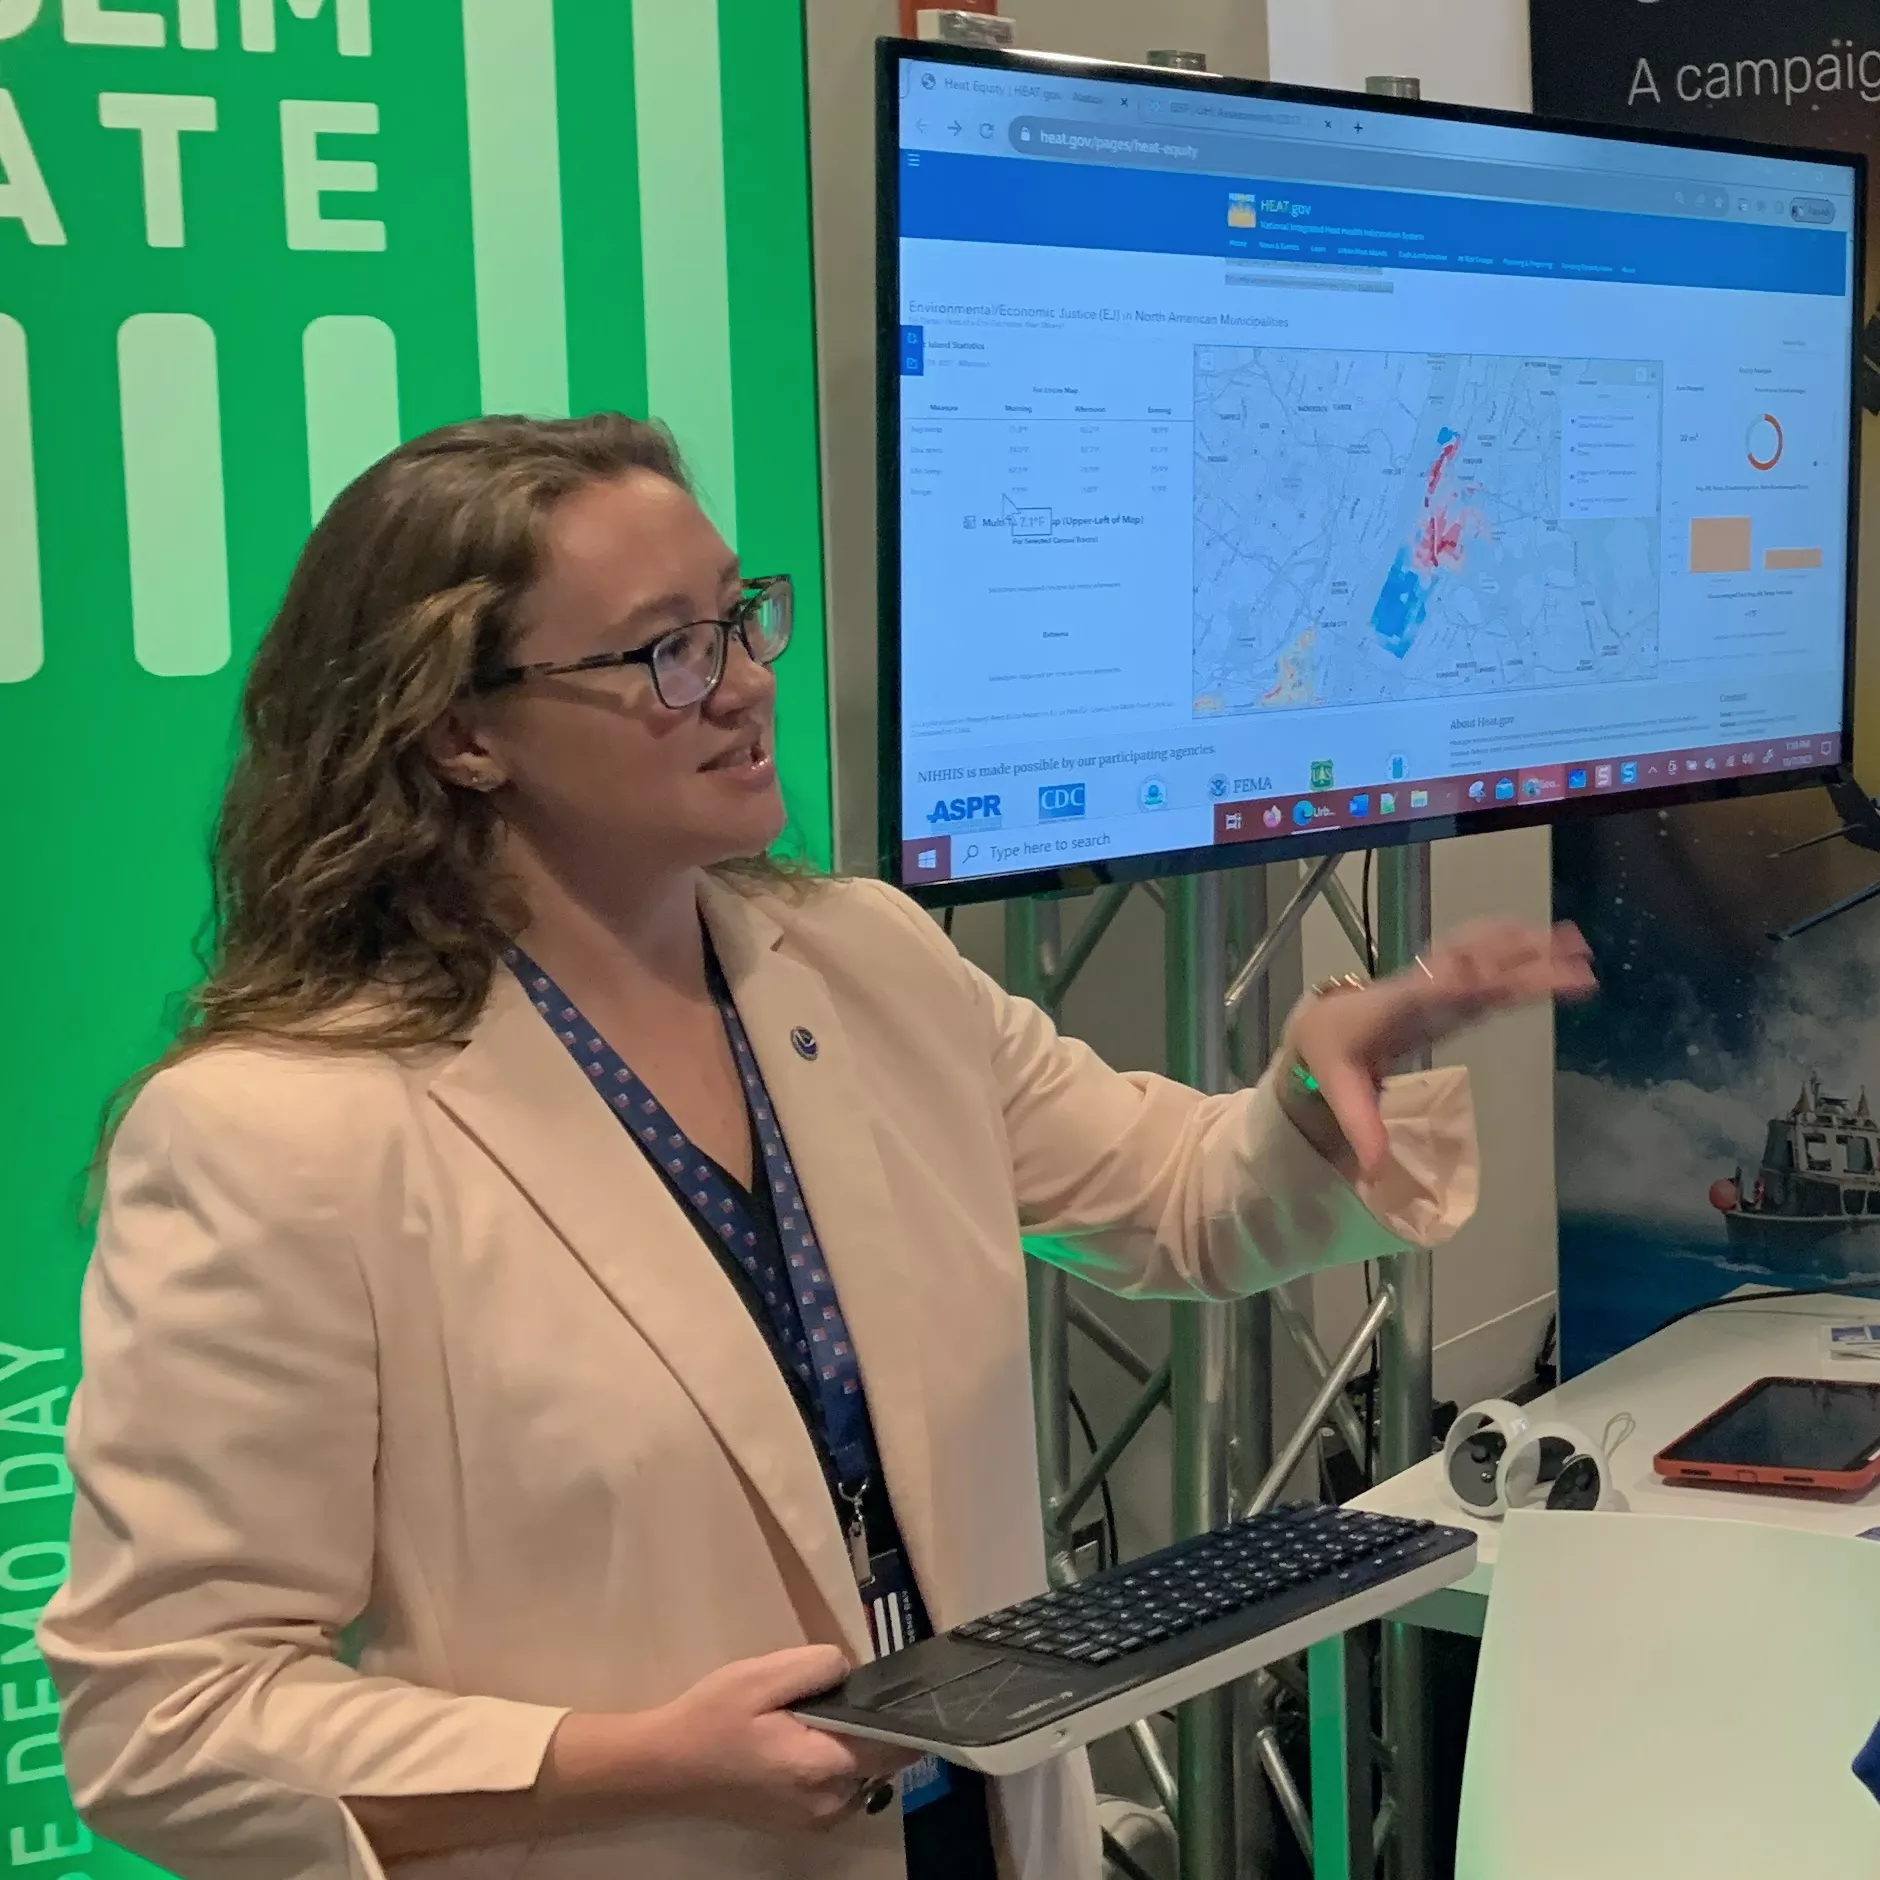
"Extreme heat kills more Americans each year than any other weather-related event – and heat is not distributed equally across neighborhoods. To address this issue, NOAA is working with interested partners, local communities, and community volunteers to collect heat data. This project spreads awareness about heat, and it engages the very people who are exposed. We have worked with more than 80 communities across the country and internationally to map their heat distribution and implement equitable cooling solutions such as tree planting, adding shading, creating heat action plans, and more."