Create Earth's changing greenery with paint dots, representing JPSS satellite observations of North America during each season.
Lesson Plan
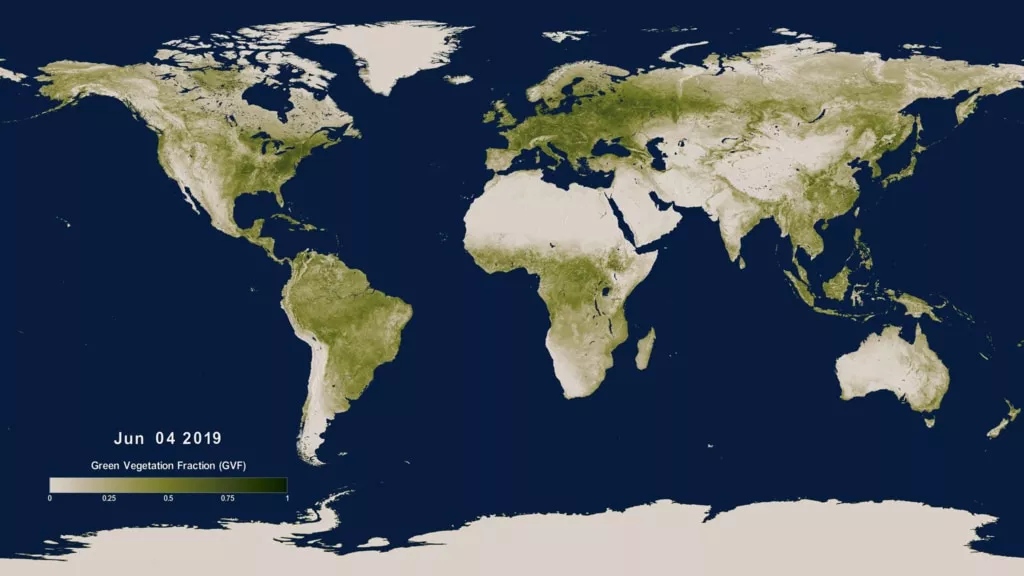
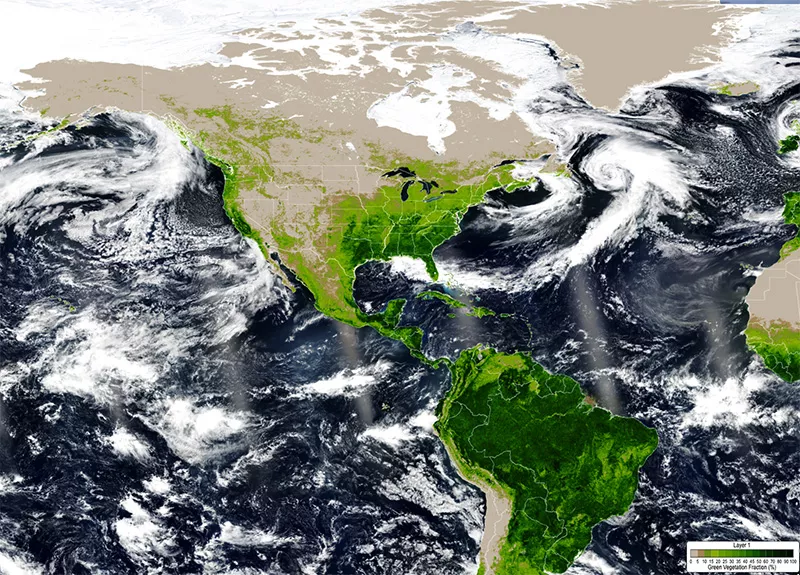
The National Oceanic and Atmospheric Administration (NOAA) and National Aeronautics and Space Administration (NASA)’s Joint Polar Satellite System (JPSS) satellites help observe Earth’s changing seasons (Spring, Summer, Fall, and Winter) as they make a polar orbit around Earth 14 times a day to capture a complete view of our planet. Scientists can use JPSS satellite greening data to highlight plants like trees and flowers in different places on Earth based on the time of year. During the Summer in Earth’s Northern Hemisphere, more greenery can be seen on a map of Earth, while less greenery appears in the Southern Hemisphere since they experience opposite seasonal changes.
Objective
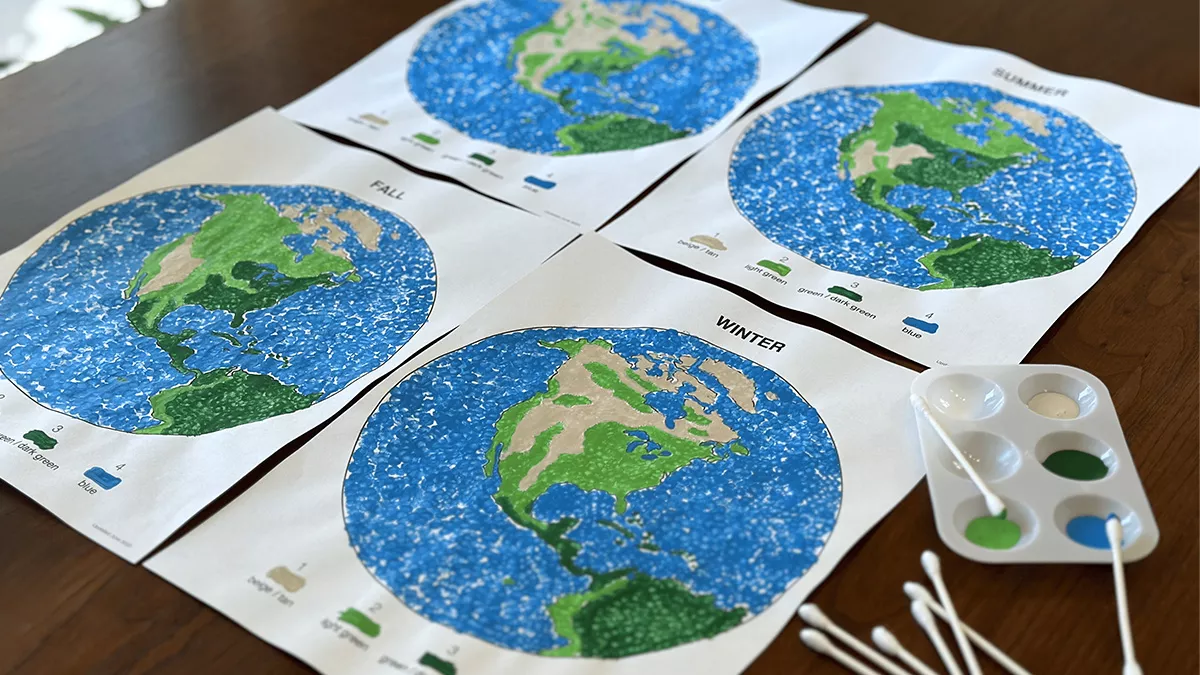
In this activity, students will dip a cotton-tipped swab in dark green, light green, beige and blue paint to create small dots on a black and white map of Earth, focusing on the Northern Hemisphere (and part of the Southern Hemisphere). Dark green paint will be used to show dense areas of plant growth, light green will show moderate amounts, beige will show sparse vegetation, and blue will indicate Earth’s ocean and lakes.
These dots represent the data points that JPSS polar-orbiting satellites collect to create a full view of Earth’s changing greenery, as each season begins and ends. Each worksheet that maps the changing greenery of the four seasons directly corresponds with real data from JPSS satellites. The Spring worksheet is based on JPSS satellite data from April 12, 2023, Summer is based on data from August 12, 2022, Fall is based on data from October 12, 2022, and Winter is based on data from December 12, 2022.
Dots should be placed on the Northern or Southern Hemisphere of the provided image of Earth. Based on JPSS satellite data, this greening activity will help students identify how plants change at different times of the year in different locations, based on the changing seasons.
Materials
You will need:
- Four cotton-tipped swabs (one for each paint color)
- Four toothpicks to use over small areas on the provided image of Earth (one for each paint color)
- Paper plate (for paints)
- Dark green paint
- Light green paint
- Tan/beige/brown paint
- Blue paint
- Printed copies of a black and white image of Earth (a worksheet for each season is attached to this activity packet)
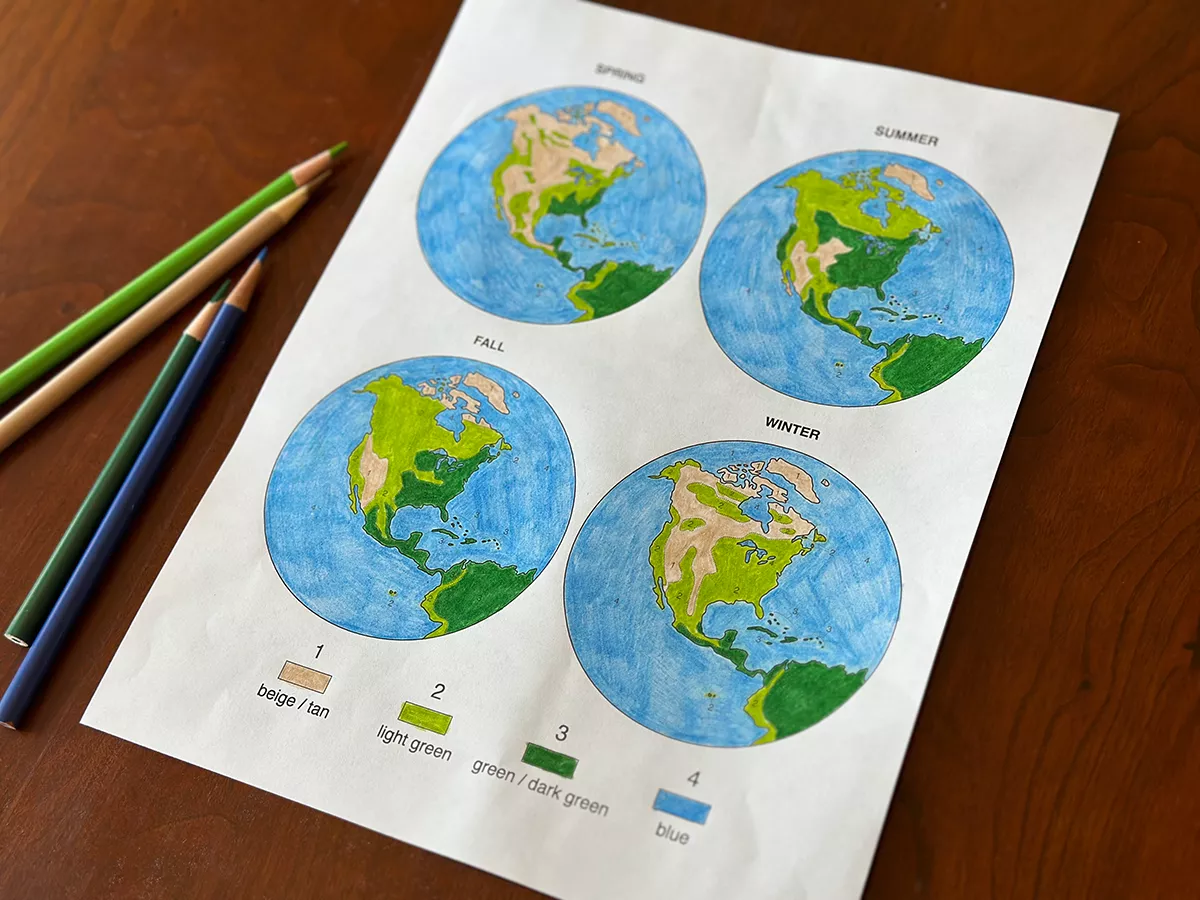
Alternative Option
Use beige, blue, light green, and dark green colored pencils or fine tipped colored markers to color the four quadrant worksheet that includes Earth during each season (Spring, Summer, Winter, and Fall).