Interactive Maps

NESDIS collects vast amounts of data from satellites to support NOAA's mission to understand and predict changes in climate, weather, oceans, and coasts, and then share that knowledge and information with others. Applications that utilize Geographic Information Systems (GIS) such as The World in Real-Time, Western Hemisphere, and Global Archive below present data as imagery on models of the earth. Zoom to increase the resolution of the imagery, pan to visit specific places, and click through the menus for further information.

Scroll back and forth through time using the image sequences found in Visible and Infrared Imagery, Colorized Infrared and Water Vapor Imagery. These simple interfaces allow a focused view of weather development over the continental United States. 

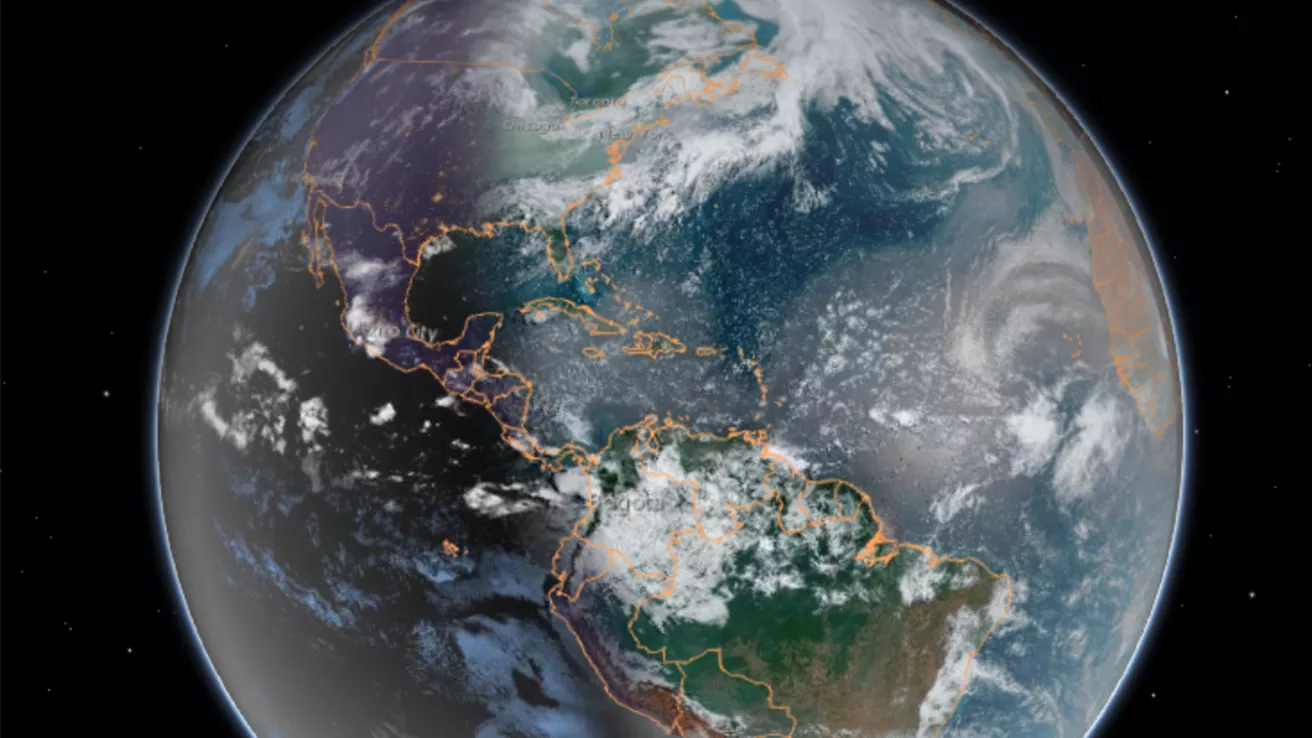
GOES GeoColor western hemisphere
Select data from geostationary and polar-orbiting satellites, always up to the minute.
Explore interactively
Image of the Western Hemisphere
GOES GeoColor Imagery of the Western Hemisphere and Pacific Ocean collected over the last 24-hours.
Animate through time
NOAA-20 True Color Atlantic basin
View latest daylight imagery and multiyear archive over the whole Earth as captured by the JPSS polar satellites.
View Earth's atmosphere
GOES visible and infrared over continental United States
Continental United States from GOES East and West, combining bands 1 and 13 for day/night continuity, over "Blue Marble" data.
Watch storms progress
GOES infrared over the continental United States
Applying color enhancements to GOES band 13 imagery highlights progressively colder cloud tops, indicating severity of storm development.
Find highest cloud tops
GOES water vapor over the continental United States
GOES water vapor band 10 senses moisture content in the atmosphere, a vital component in forecasting rainfall and flooding.
Track rain intensity
Airmass data of the northeast United States
The GOES East and GOES West satellites provide up-to-the-minute views of the Western Hemisphere. These regional maps, provided by NESDIS' Center for Satellite Applications and Research (STAR), contain technical information from each satellite channel for scientists.
Explore imagery by region
Aerosol satellite imagery of United States
There are many different types of particles in the air that NOAA satellites help us study. This map, provided by NESDIS' Center for Satellite Applications and Research (STAR), contains technical information about these particles for scientists.
See aerosol layers