Ten years ago, the U.S. was slammed by one of the most destructive storms in its history—a late-season monster named Sandy.
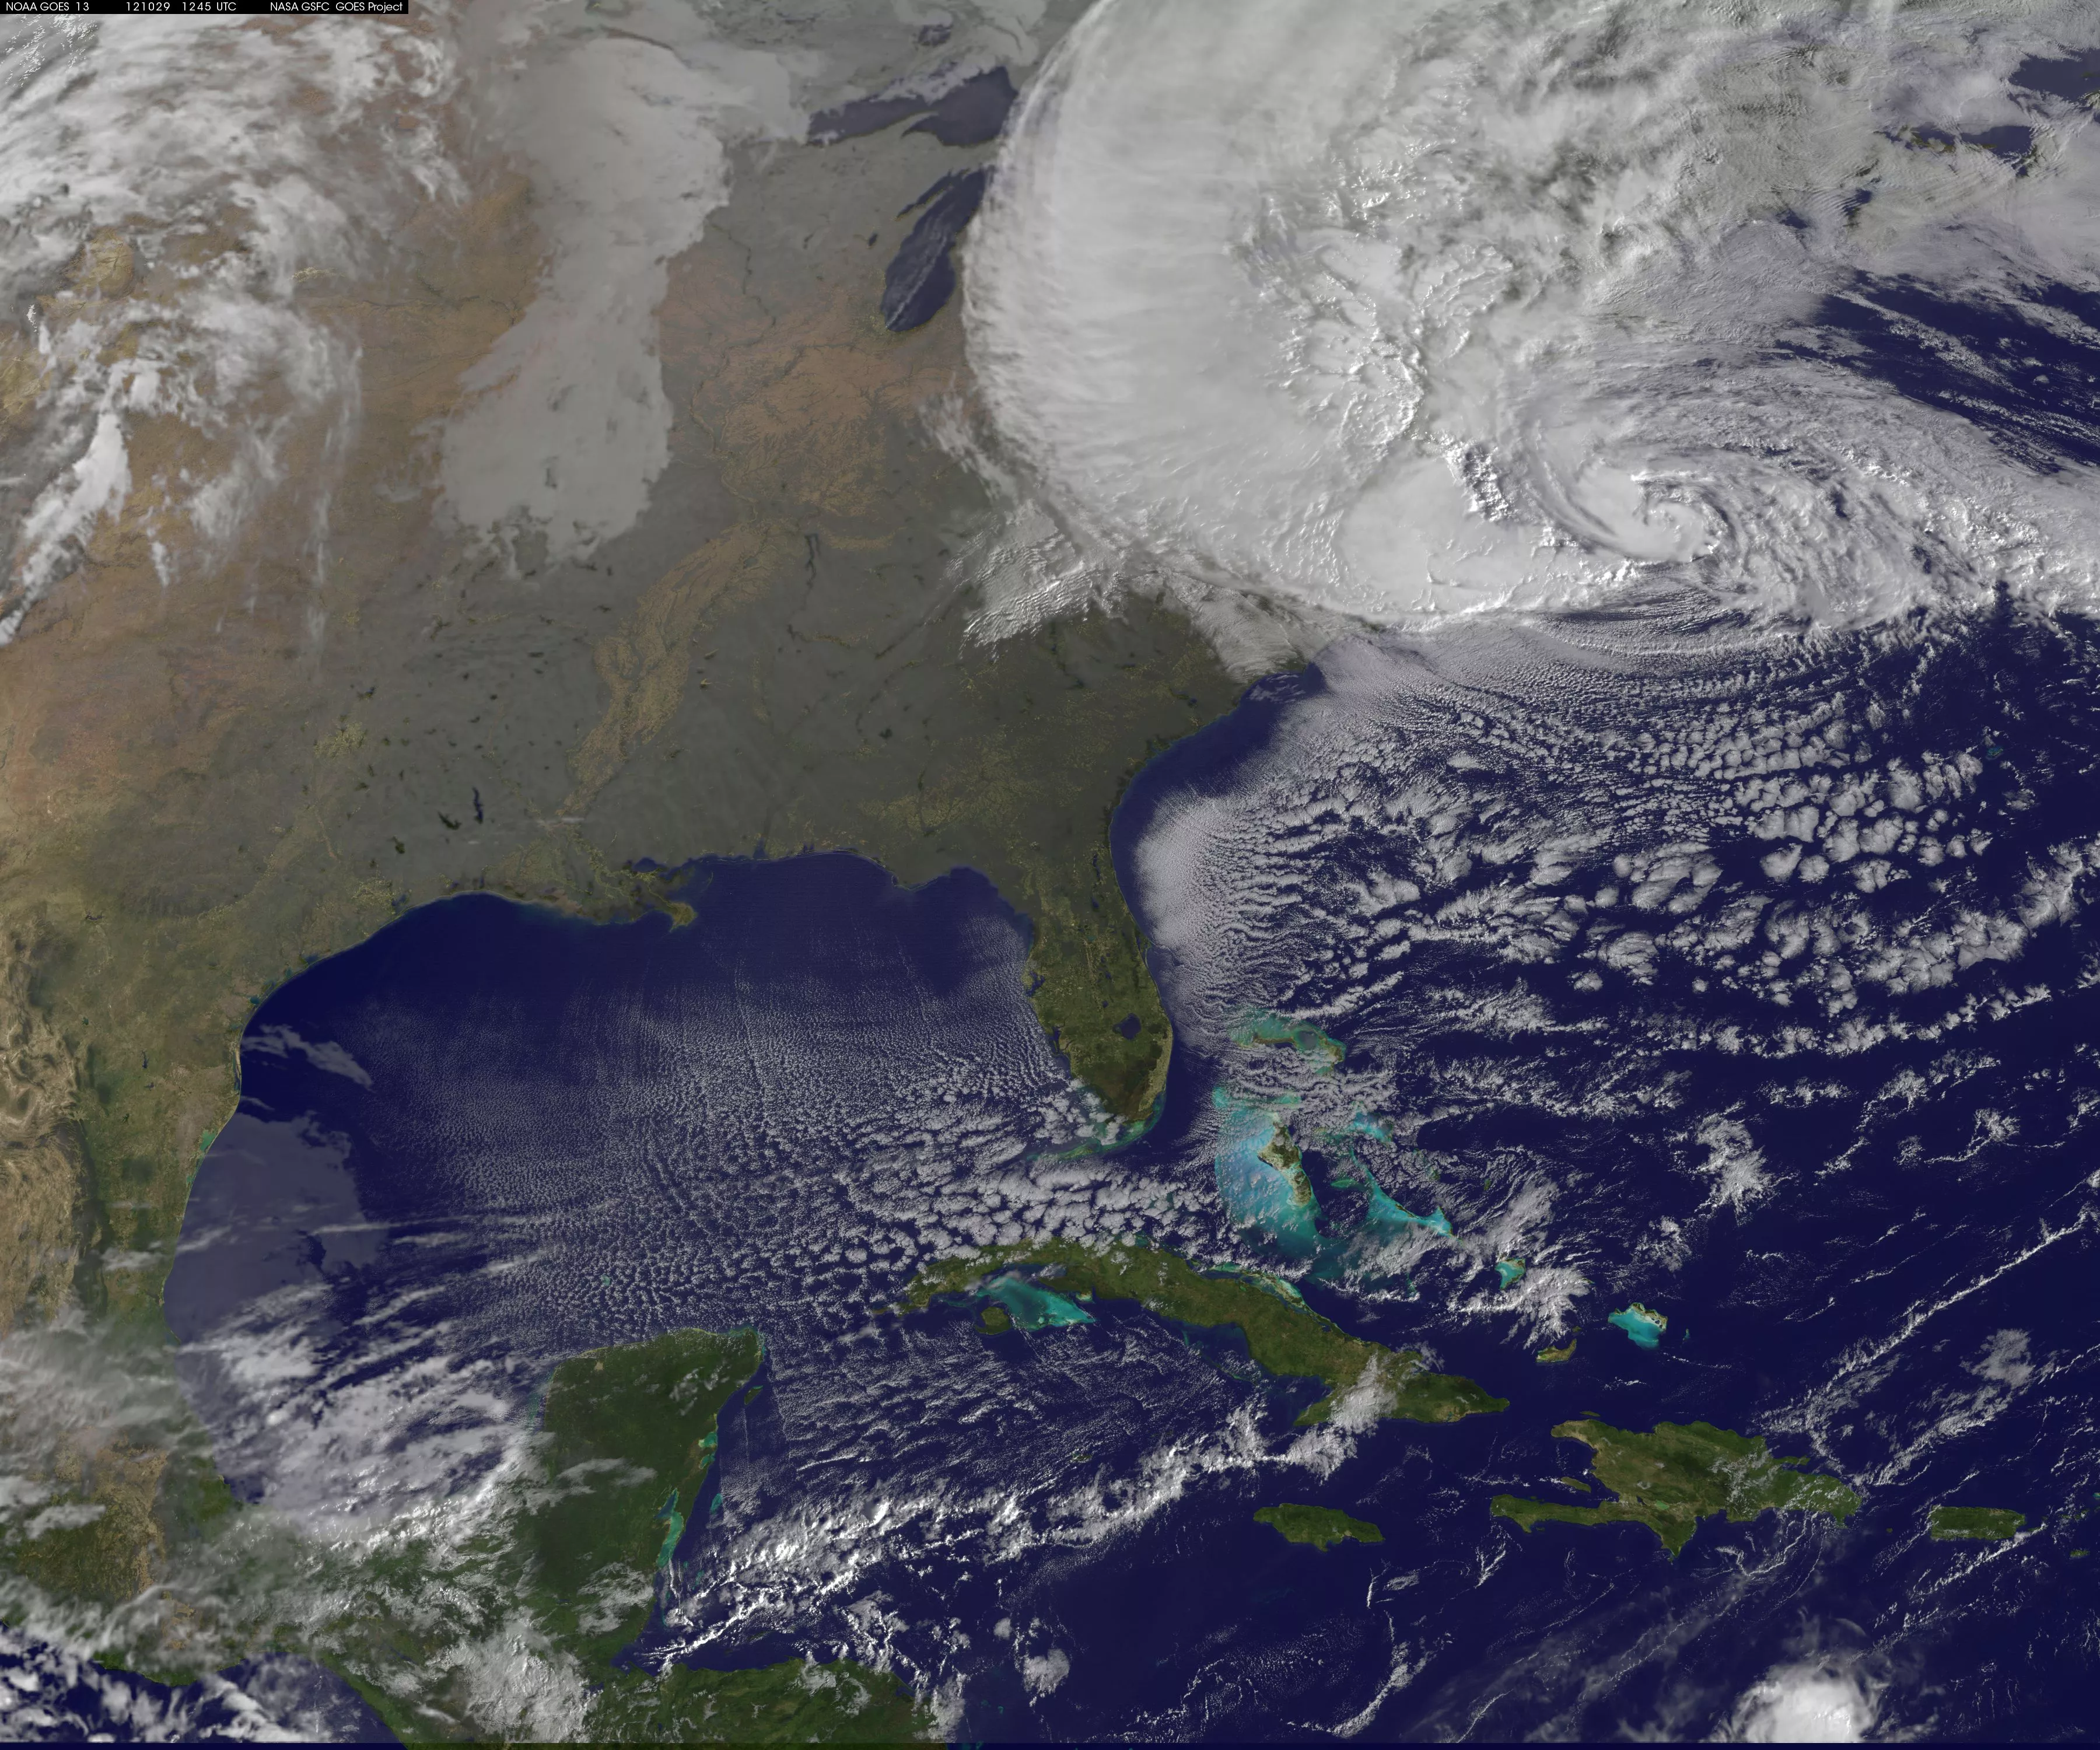
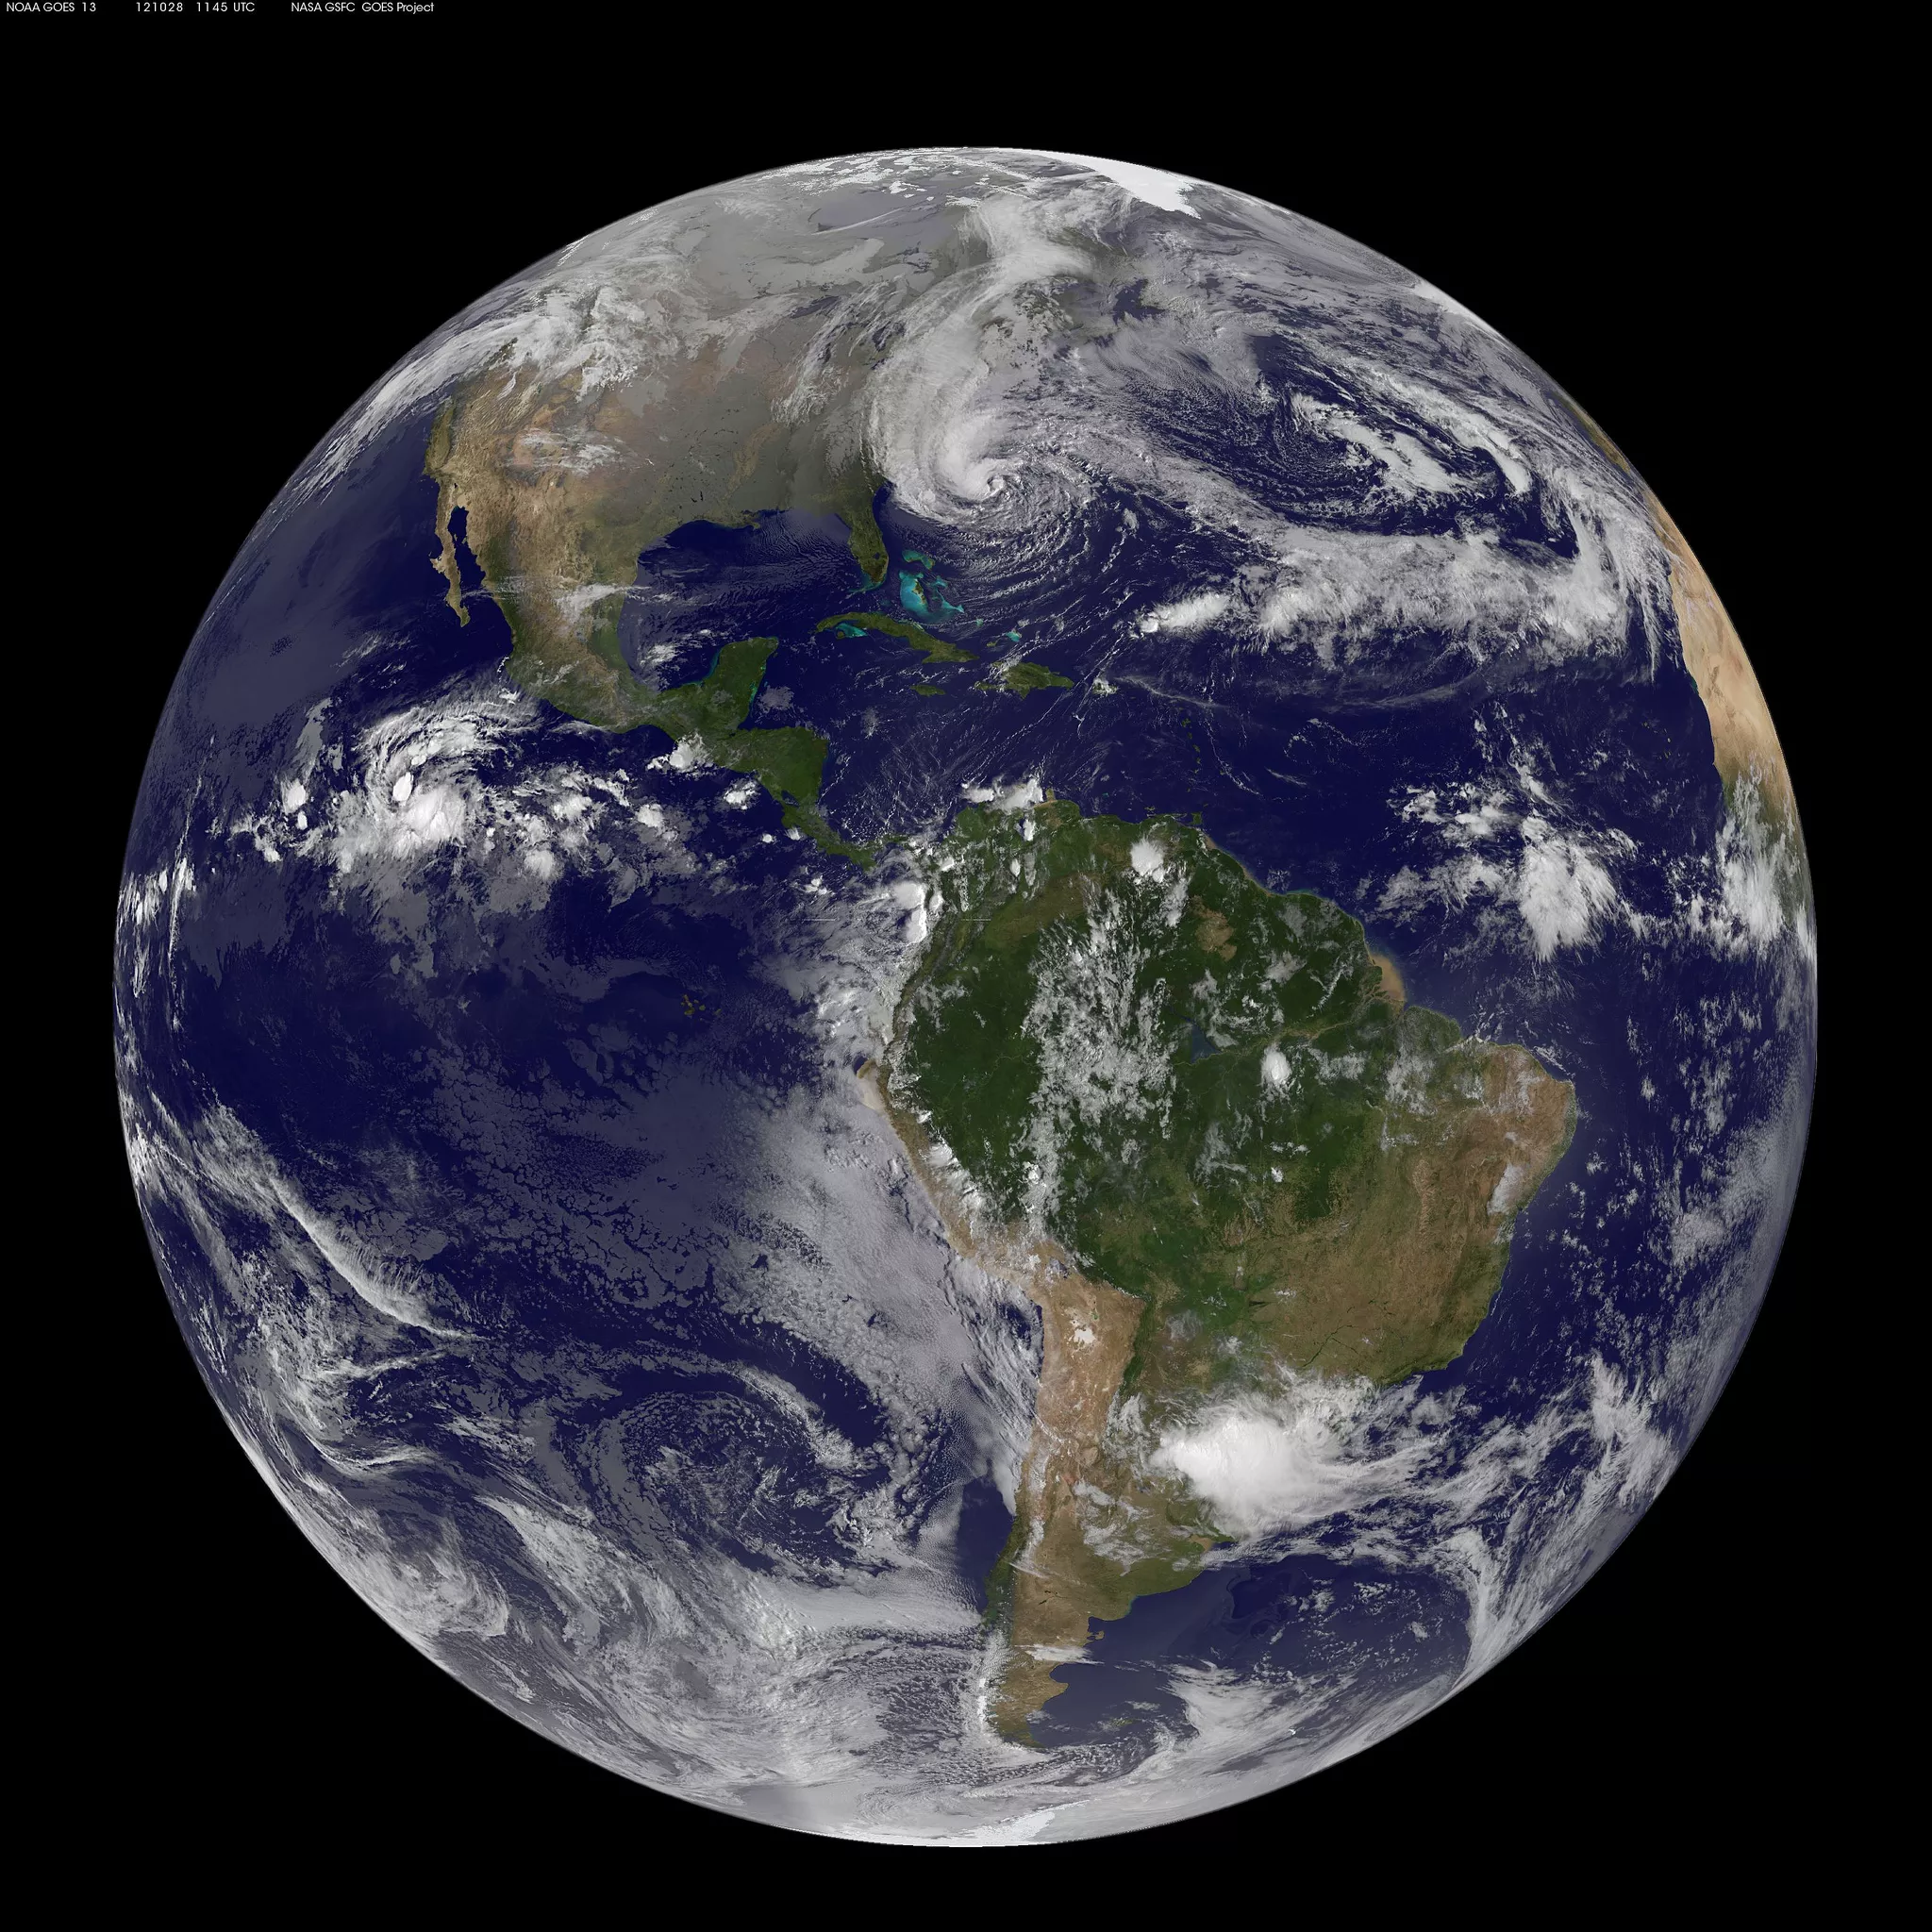
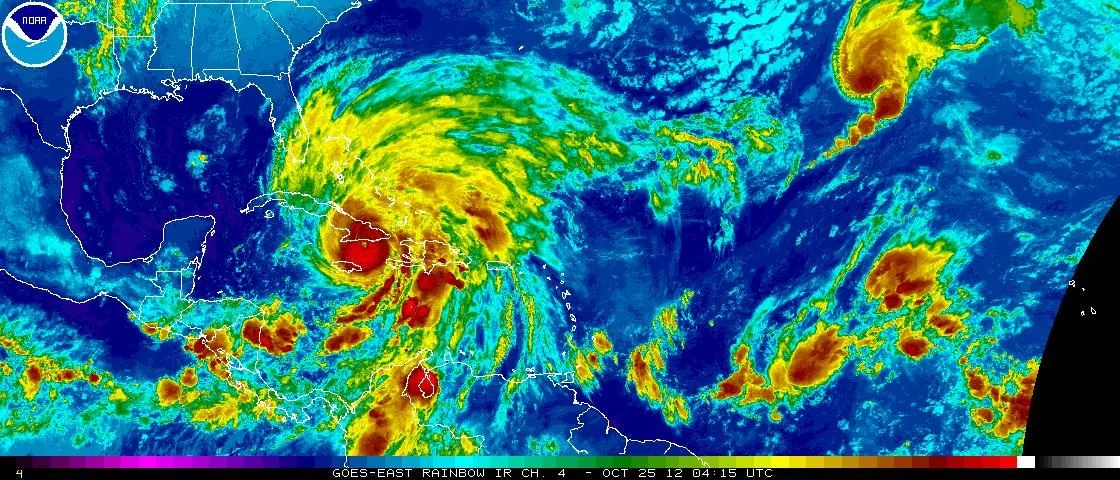
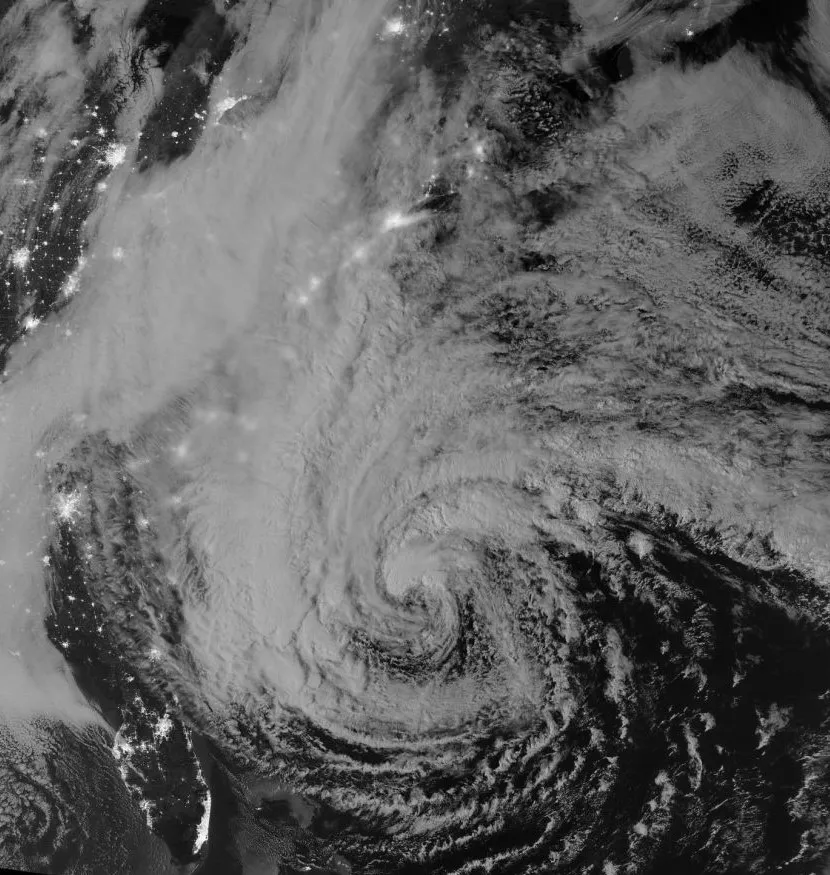
Hurricane Sandy was the 18th named tropical cyclone of the busy 2012 Atlantic hurricane season that produced a total of 19 named storms. Sandy’s path took it across the central Caribbean before it tracked northward across Jamaica, eastern Cuba, and the Bahamas. Sandy then moved northeastward along the U.S. East Coast before turning sharply westward toward the mid-Atlantic coast. Just before making landfall near Brigantine, New Jersey on the evening of October 29, Sandy transitioned into a post-tropical cyclone with sustained winds of around 80 mph.
Because of its tremendous size, Sandy drove a catastrophic storm surge into the New Jersey and New York coastlines. Damage estimates were near $82 billion, making Sandy the fourth-costliest tropical cyclone to hit the U.S. on record as of August 2022, behind Hurricanes Katrina (costliest), Harvey (2nd) and Maria (3rd). There were at least 147 direct deaths recorded across the Atlantic basin due to Sandy, with 72 of these fatalities occurring in the mid-Atlantic and northeastern U.S.
From Sandy’s birth to its dissipation, NOAA satellites kept close watch on the storm, providing forecasters with critical information on its size, intensity, and predicted track. Below is a look back at Sandy as seen from NOAA’s eyes in the sky.
Ten Years Later
Since Sandy, there have been many enhancements to how NOAA monitors and predicts tropical cyclones—from its latest generation satellite fleet to improved forecasts and more comprehensive watches and warnings ahead of a landfalling storm.
NOAA's newest series of Geostationary Operational Environmental Satellites (GOES) keeps a constant eye over our part of Earth—from New Zealand to western Africa. Launched in 2016, GOES-16 was the first of the series to launch. It watches over the Atlantic basin and improves hurricane track and intensity forecasts with its increased spectral channels and greater spatial and temporal resolution. For tropical cyclones that threaten Hawaii and other places in the Pacific Ocean, the data and imagery from NOAA’s GOES-17 and -18 satellites are critical for their accurate monitoring and prediction.
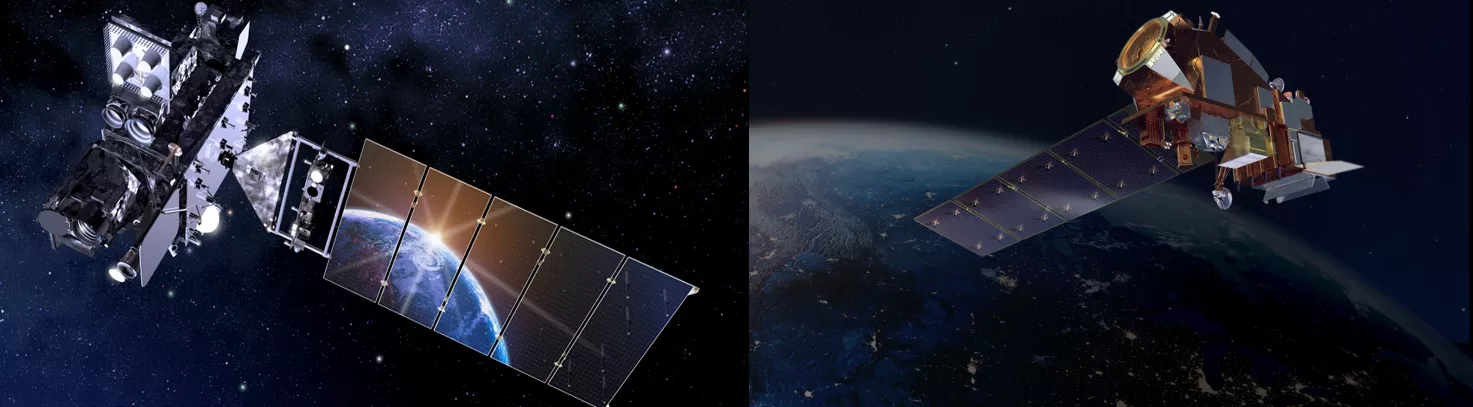
NOAA’s latest Joint Polar Satellite System (JPSS) provides global observations that serve as the backbone of both short- and long-term forecasts, including those that help us predict and prepare for severe weather events and tropical cyclones. In November 2022, the JPSS-2 satellite will launch from California’s Vandenberg Space Force Base and join two other JPSS satellites in orbit around Earth—Suomi-NPP and NOAA-20.
Together, these geostationary and polar-orbiting satellites will provide the U.S. with a continuous series of global weather data to secure a more "Weather-Ready” Nation for the rest of this hurricane season and the others that lie ahead.