A team of scientists from NOAA’s Satellite and Information Service (NESDIS) and South Dakota State University has developed more accurate forecasts to predict the impacts of wildfire smoke on air quality.
The efforts to create these better forecasts stemmed from the Disaster Relief Act of 2019, in which NOAA’s Office of Oceanic and Atmospheric Research (OAR), the National Weather Service (NWS), and NESDIS partnered to deliver improved forecasts of wildfire smoke impacts on air quality.
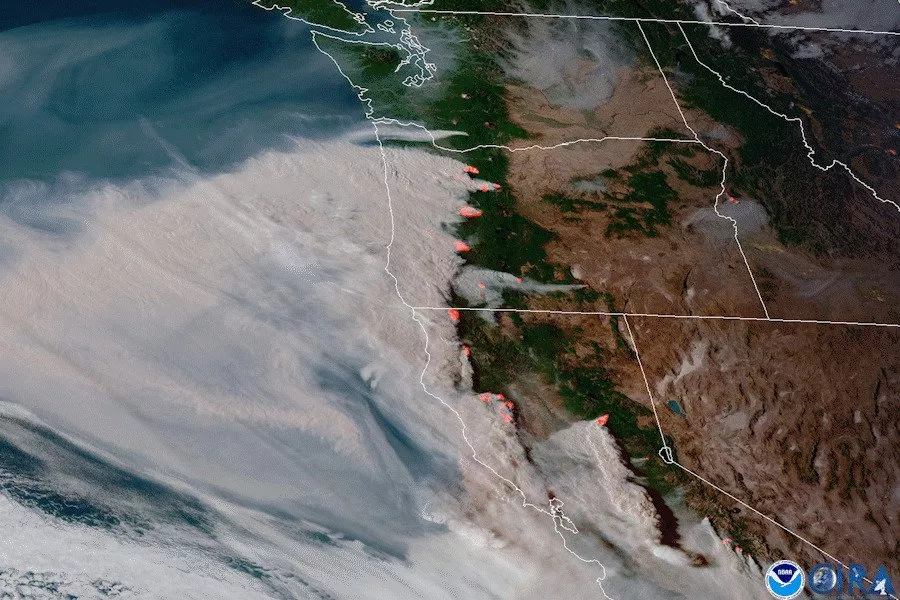
The method known as Regional Hourly Advanced Baseline Imager (ABI) and Visible Infrared Imaging Radiometer Suite (VIIRS) Emissions, or RAVE, combines observations from instruments on NOAA’s geostationary and polar-orbiting weather satellites to calculate estimates of wildfire emissions. The instruments – the ABI on the Geostationary Operational Environmental Satellite (GOES) program’s, GOES-16 and GOES-17, and the VIIRS on the Joint Polar Satellite System (JPSS) program’s NOAA-20 – can detect the heat signature, or fire radiative power, from wildfires.
This attribute makes them ideal for monitoring air quality because wildfires are a source of harmful air pollutants including smoke, various volatile and semi-volatile organic compounds, and nitrogen oxides that form ozone and particulate matter. Fine particulate matter (PM2.5), which is 2.5 micrometers or less in diameter – about 30 times smaller than the diameter of an average human hair – is especially concerning because those particles penetrate deep into human lungs and cause various upper respiratory diseases, including premature death.
Poor air quality is linked to hundreds of thousands of premature deaths in the United States annually. Globally, smoke from landscape fires accounts for close to 340,000 deaths annually. And, in a study recently published in Lancet Planetary Health, short-term exposure to wildfire-related PM2.5 pollution was linked to an elevated risk of death.
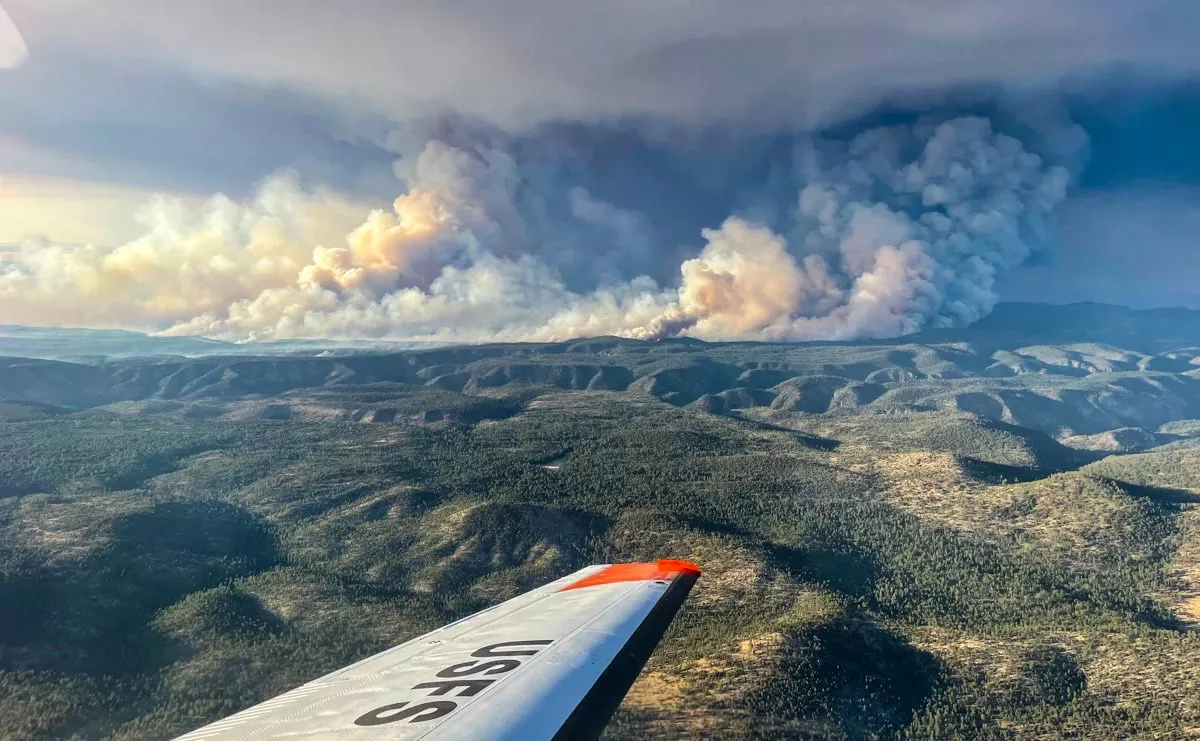
In a recent announcement on wildfire incidents, the National Interagency Fire Center (NIFC) shared that, “through mid-May of 2022 there have been over 25,000 wildfires consuming 1.4M acres, surpassing the 10 year annual average for the number of fires during this same timeframe by over 6,000 fires. Climate change will only exacerbate heat and drought, which along with severe storms make wildfire conditions worse."
Dr. Shobha Kondragunta, a physical scientist at NESDIS and lead for the RAVE project, said earlier fire emission models were limited in their capabilities. “This is because polar orbiting satellites, which circle the Earth from pole to pole, can only view portions of the globe at a time and this limits the information they can glean from a quickly evolving wildfire. The addition of GOES satellite data, however, helps resolve this issue.”
Geostationary satellites orbit at the same rate as the earth rotates, continuously viewing the same spot, allowing them to provide continuous observations, and closely follow rapidly changing wildfires. The ABI instrument’s ability to observe an area continuously enables RAVE to capture the diurnal cycle of emissions caused by active wildfires.
“Weather conditions change during the day. The new hour-by-hour wildfire emissions from RAVE help us develop better computer models to predict how wildfires cause poor air quality near the fires and even across the country,” said Dr. Ivanka Stajner, Deputy Director of the Environmental Modeling Center (EMC) at NOAA's NWS.
Did RAVE Make a Difference?
The RAVE is an upgrade to the current benchmark, the NESDIS Global Biomass Burning Emissions Product, that the NWS provides as input to the Community Multiscale Air Quality (CMAQ) modeling system. The CMAQ modeling system is the basis for operational air quality forecasts.
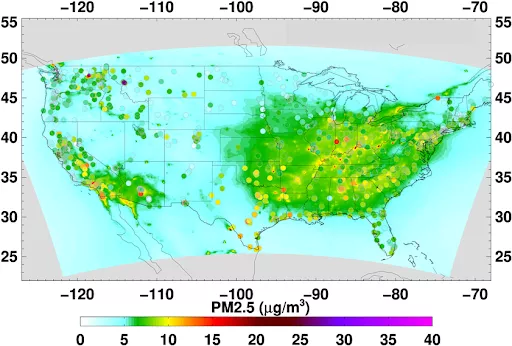
Dr. Kondragunta explained that the online CMAQ model was first tested with the NESDIS Global Biomass Burning Emissions Product. Simulations from the prototype online CMAQ model were applied over the continental U.S. for August 2019 using RAVE hourly fire emissions. The model predictions of surface PM2.5 were much closer to the true values, including a significantly more accurate estimate of the number of times the National Ambient Air Quality Standard for PM2.5 at 35 micrograms per cubic meter of air (35 µg/m3) had been exceeded.
This is the threshold for exposure that, if exceeded during a 24-hour period, the Environmental Protection Agency (EPA) considers unsafe, particularly for sensitive individuals. Local environmental agencies in more than 360 U.S. cities and localities issue air quality alerts when the daily average concentrations of PM2.5 are greater than the EPA standard.
Compared to fire emissions information from polar-orbiting satellite instruments, RAVE’s hourly fire emissions resulted in reductions in false alarms by a factor of 100 because the changes of daytime emissions data associated with highs and lows of fire activity are now captured by the model.
What’s Next
Fire emission estimates from RAVE are being tested on the CMAQ variant used at the NWS. Dr. Kondragunta and her colleagues see the development of accurate hourly fire emissions as key to improving predictions, which is critical to enable local governments to provide accurate forecasts and take appropriate actions to protect public health. NWS will continue to test the RAVE emissions product to determine its performance for different types of fires ranging from small-scale agricultural fires to large-scale multi-day wildfires.
In addition to the CMAQ model, the RAVE data will be ingested into the Rapid-Refresh Forecasting System (RRFS) for high-resolution smoke forecasting over North and Central Americas. The experimental RRFS model is currently being developed for weather forecasting at NOAA’s Global Systems Laboratory. The RAVE data will be used to estimate the wildland fire emissions and heat fluxes in the RRFS-Smoke model. The RRFS-Smoke model will be initialized every hour, thus taking advantage of the high-frequency RAVE fire data.