This data visualization shows the maximum wind gusts from Hurricane Irma from September 7 to September 10, 2017. Note how the strongest wind gusts are on the north side of the storm track (the faint dotted line). According to the NOAA's National Hurricane Center, Irma's maximum sustained winds ranged from 110 (on 9/10) to near 180 (on 9/7) miles per hour during this period. This graphic was created with data from the RTMA, which uses surface observation data to create a highly accurate gridded analysis of past weather conditions. The data covers only the Continental United States and coastal areas, so areas of the storm further to the south and east, where Irma was at maximum intensity, are not visible
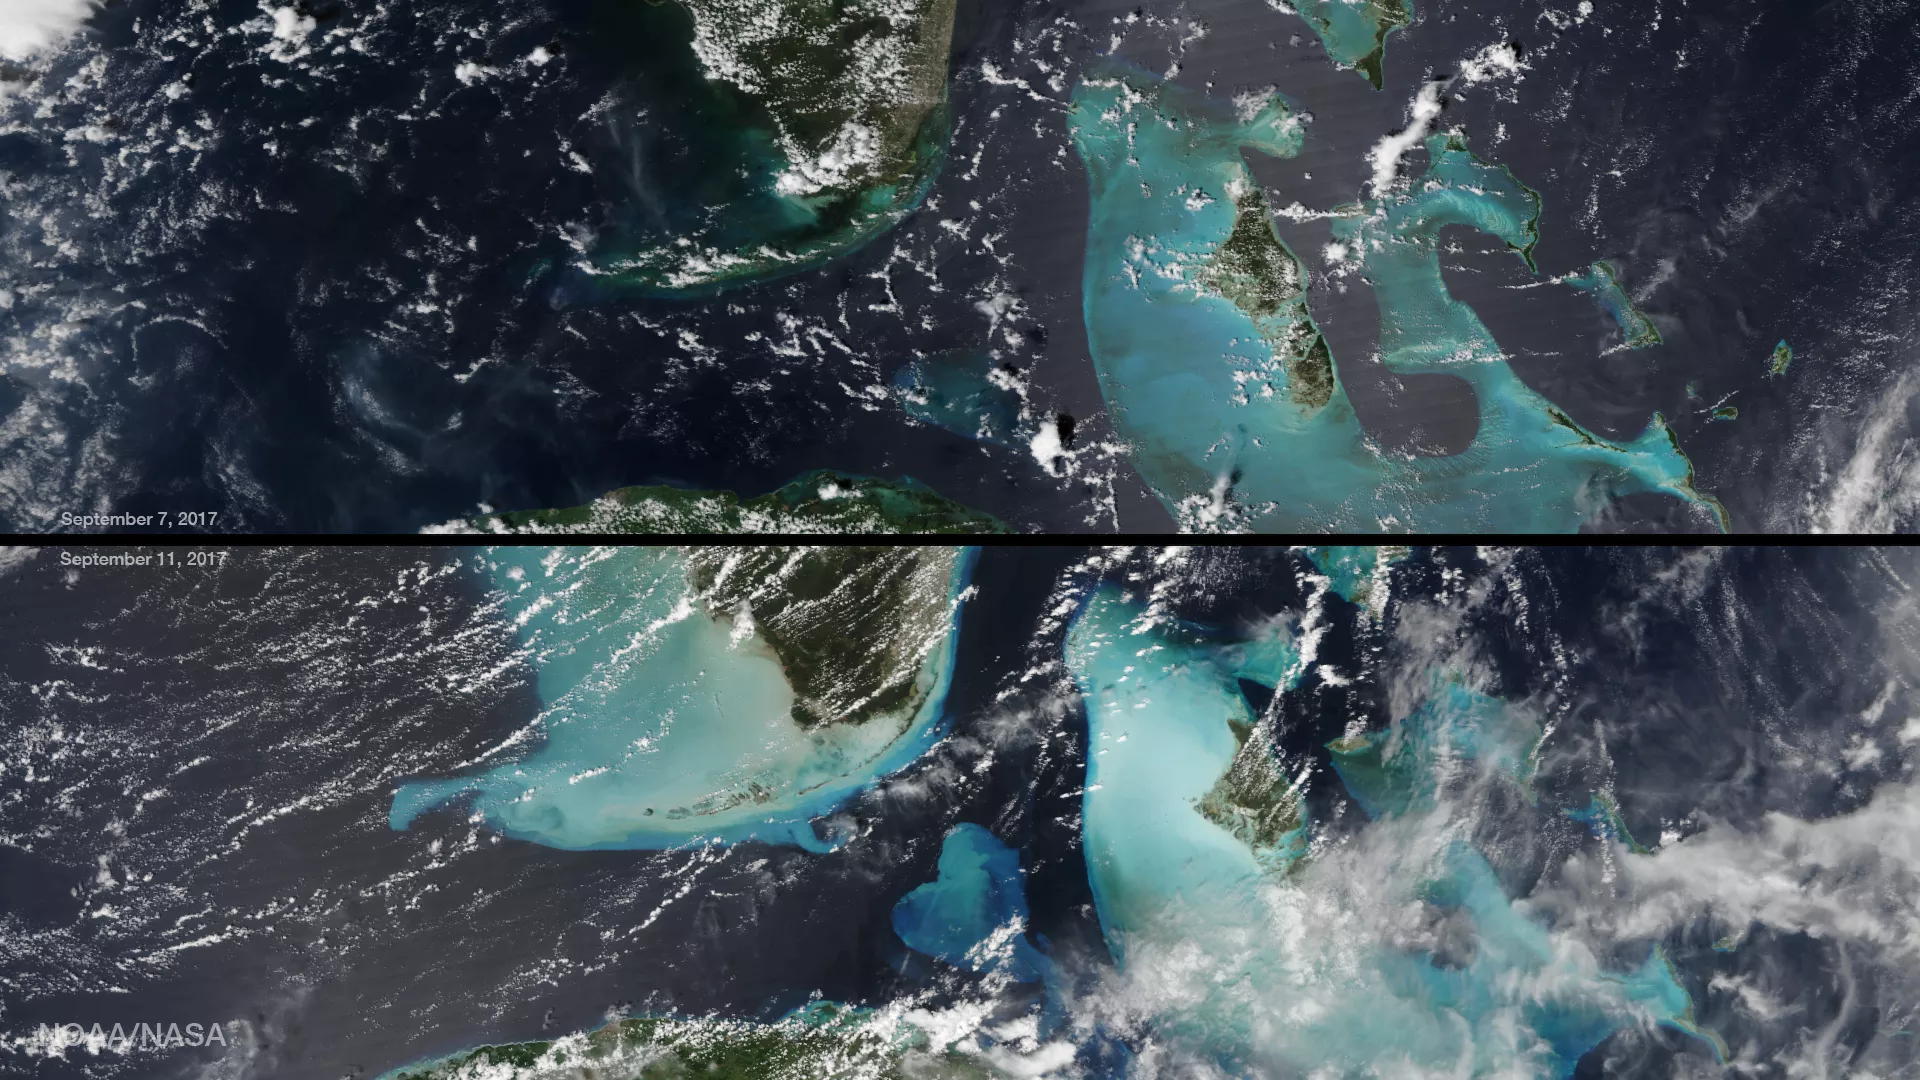
Hurricane Irma didn't just impact land. As seen in these before-and-after true-color images captured by the VIIRS instrument on the NOAA/NASA Suomi NPP satellite September 7, 2017 (top) and September 11 (bottom), the storm altered the distribution of sand around the coast of Florida. The light blue color shows sediment suspended in the water, kicked up by the intensity of the storm. According to the Florida Keys National Marine Sanctuary, damage to natural resources in the region could be significant.