NOAA’s new generation polar-orbiting satellites are seeing a dramatic reduction in the amount of air pollution in the U.S., as the COVID-19 pandemic creates an economic and societal slowdown.
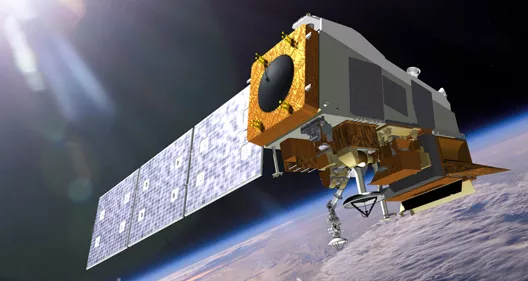
“The unintended drop in air pollution levels have become evident,” said Mitch Goldberg, chief program scientist of NOAA’s Joint Polar Satellite System (JPSS). “Observations collected from JPSS and partner satellites are giving NOAA scientists the ability to see how urban and industrial locations contribute to a region’s air pollution through the emissions of gasoline-based gases and fine particles.”
Nitrogen Dioxide (NO2) is a key component of urban air pollution. As gasoline-based vehicular traffic drops, so do NO2 emissions and airborne particulate pollution. NOAA scientists looked for the signals of decreased NO2 emissions by using instruments on the NOAA/NASA Suomi-NPP satellite and on the European Space Agency’s (ESA) Sentinel-5P satellite.
Because the COVID-related slowdown in most parts of the U.S. began in mid-March, scientists looked at both NO2 and airborne particulates for March 2019 (pre COVID-19) and March 2020 (during COVID-19). They also compared the differences between weekdays versus weekends during the same time period.
The air pollution data showed that the U.S. economic slowdown has reduced vehicular traffic, especially when considering the class of vehicle. While truck traffic has only decreased by about 20 percent since February 16, 2020, according to the Ozone Transport Commission, car traffic nationwide has dropped by about 50 percent or more. The results even show an additional reduction of all vehicle traffic on weekends.
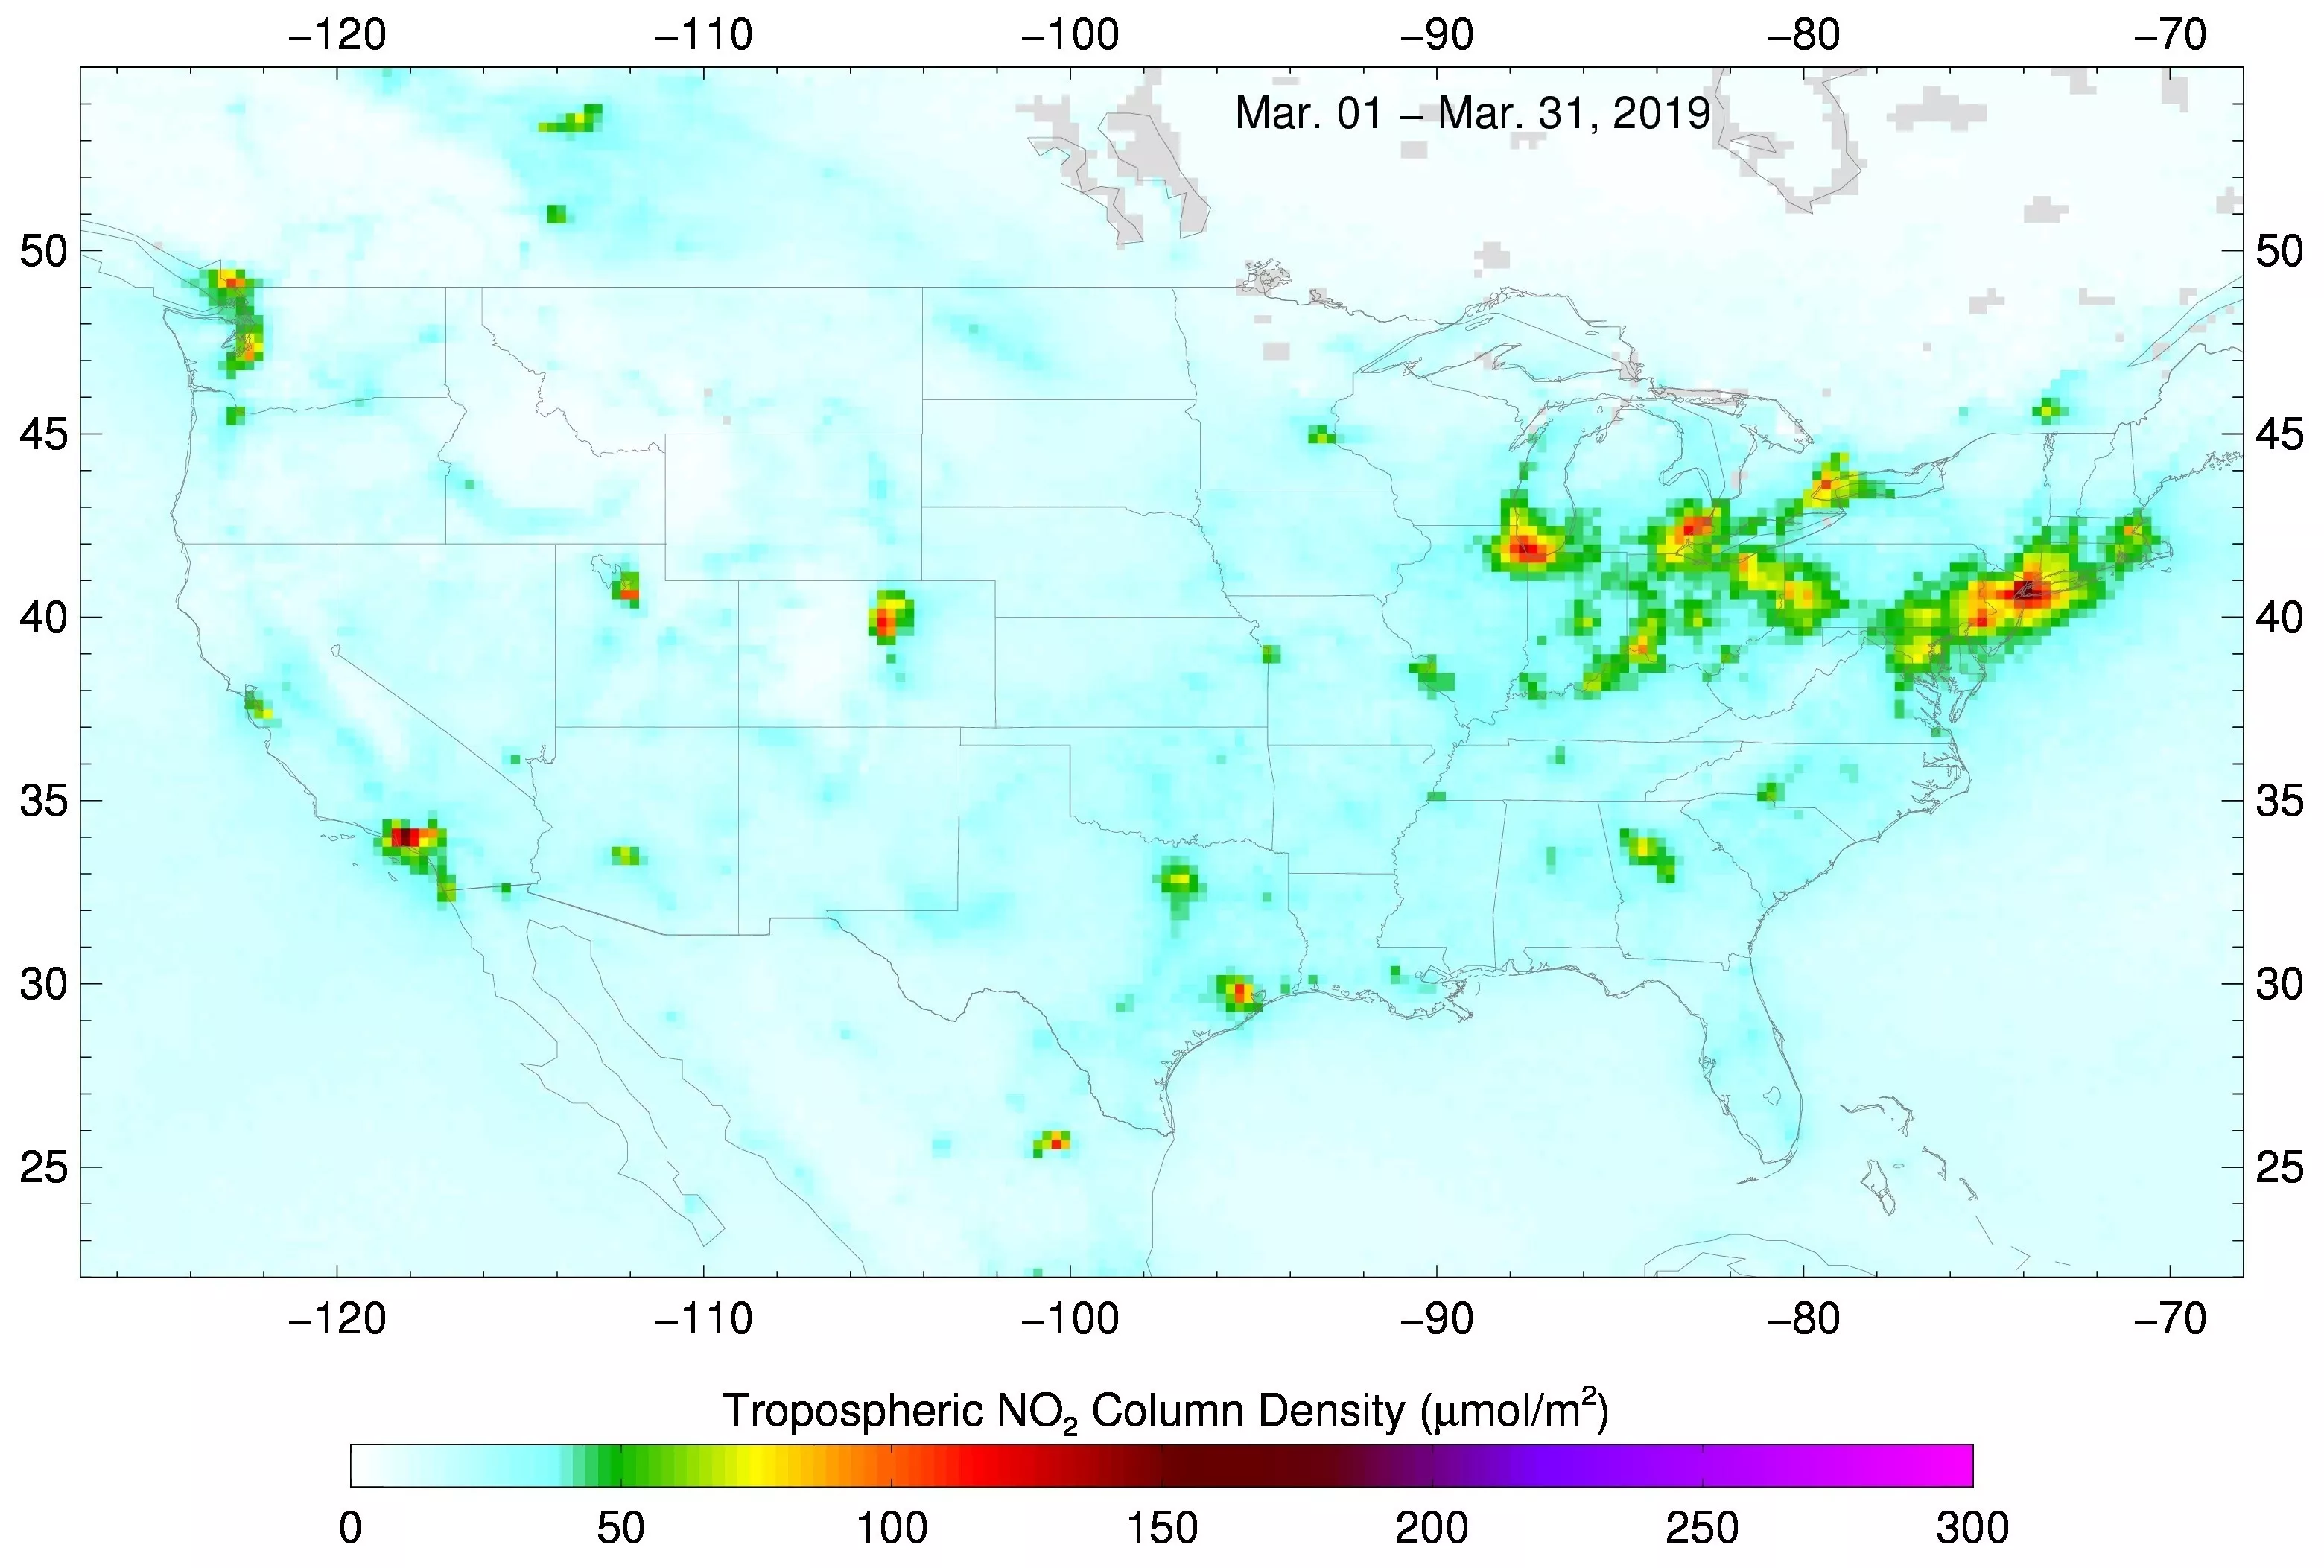
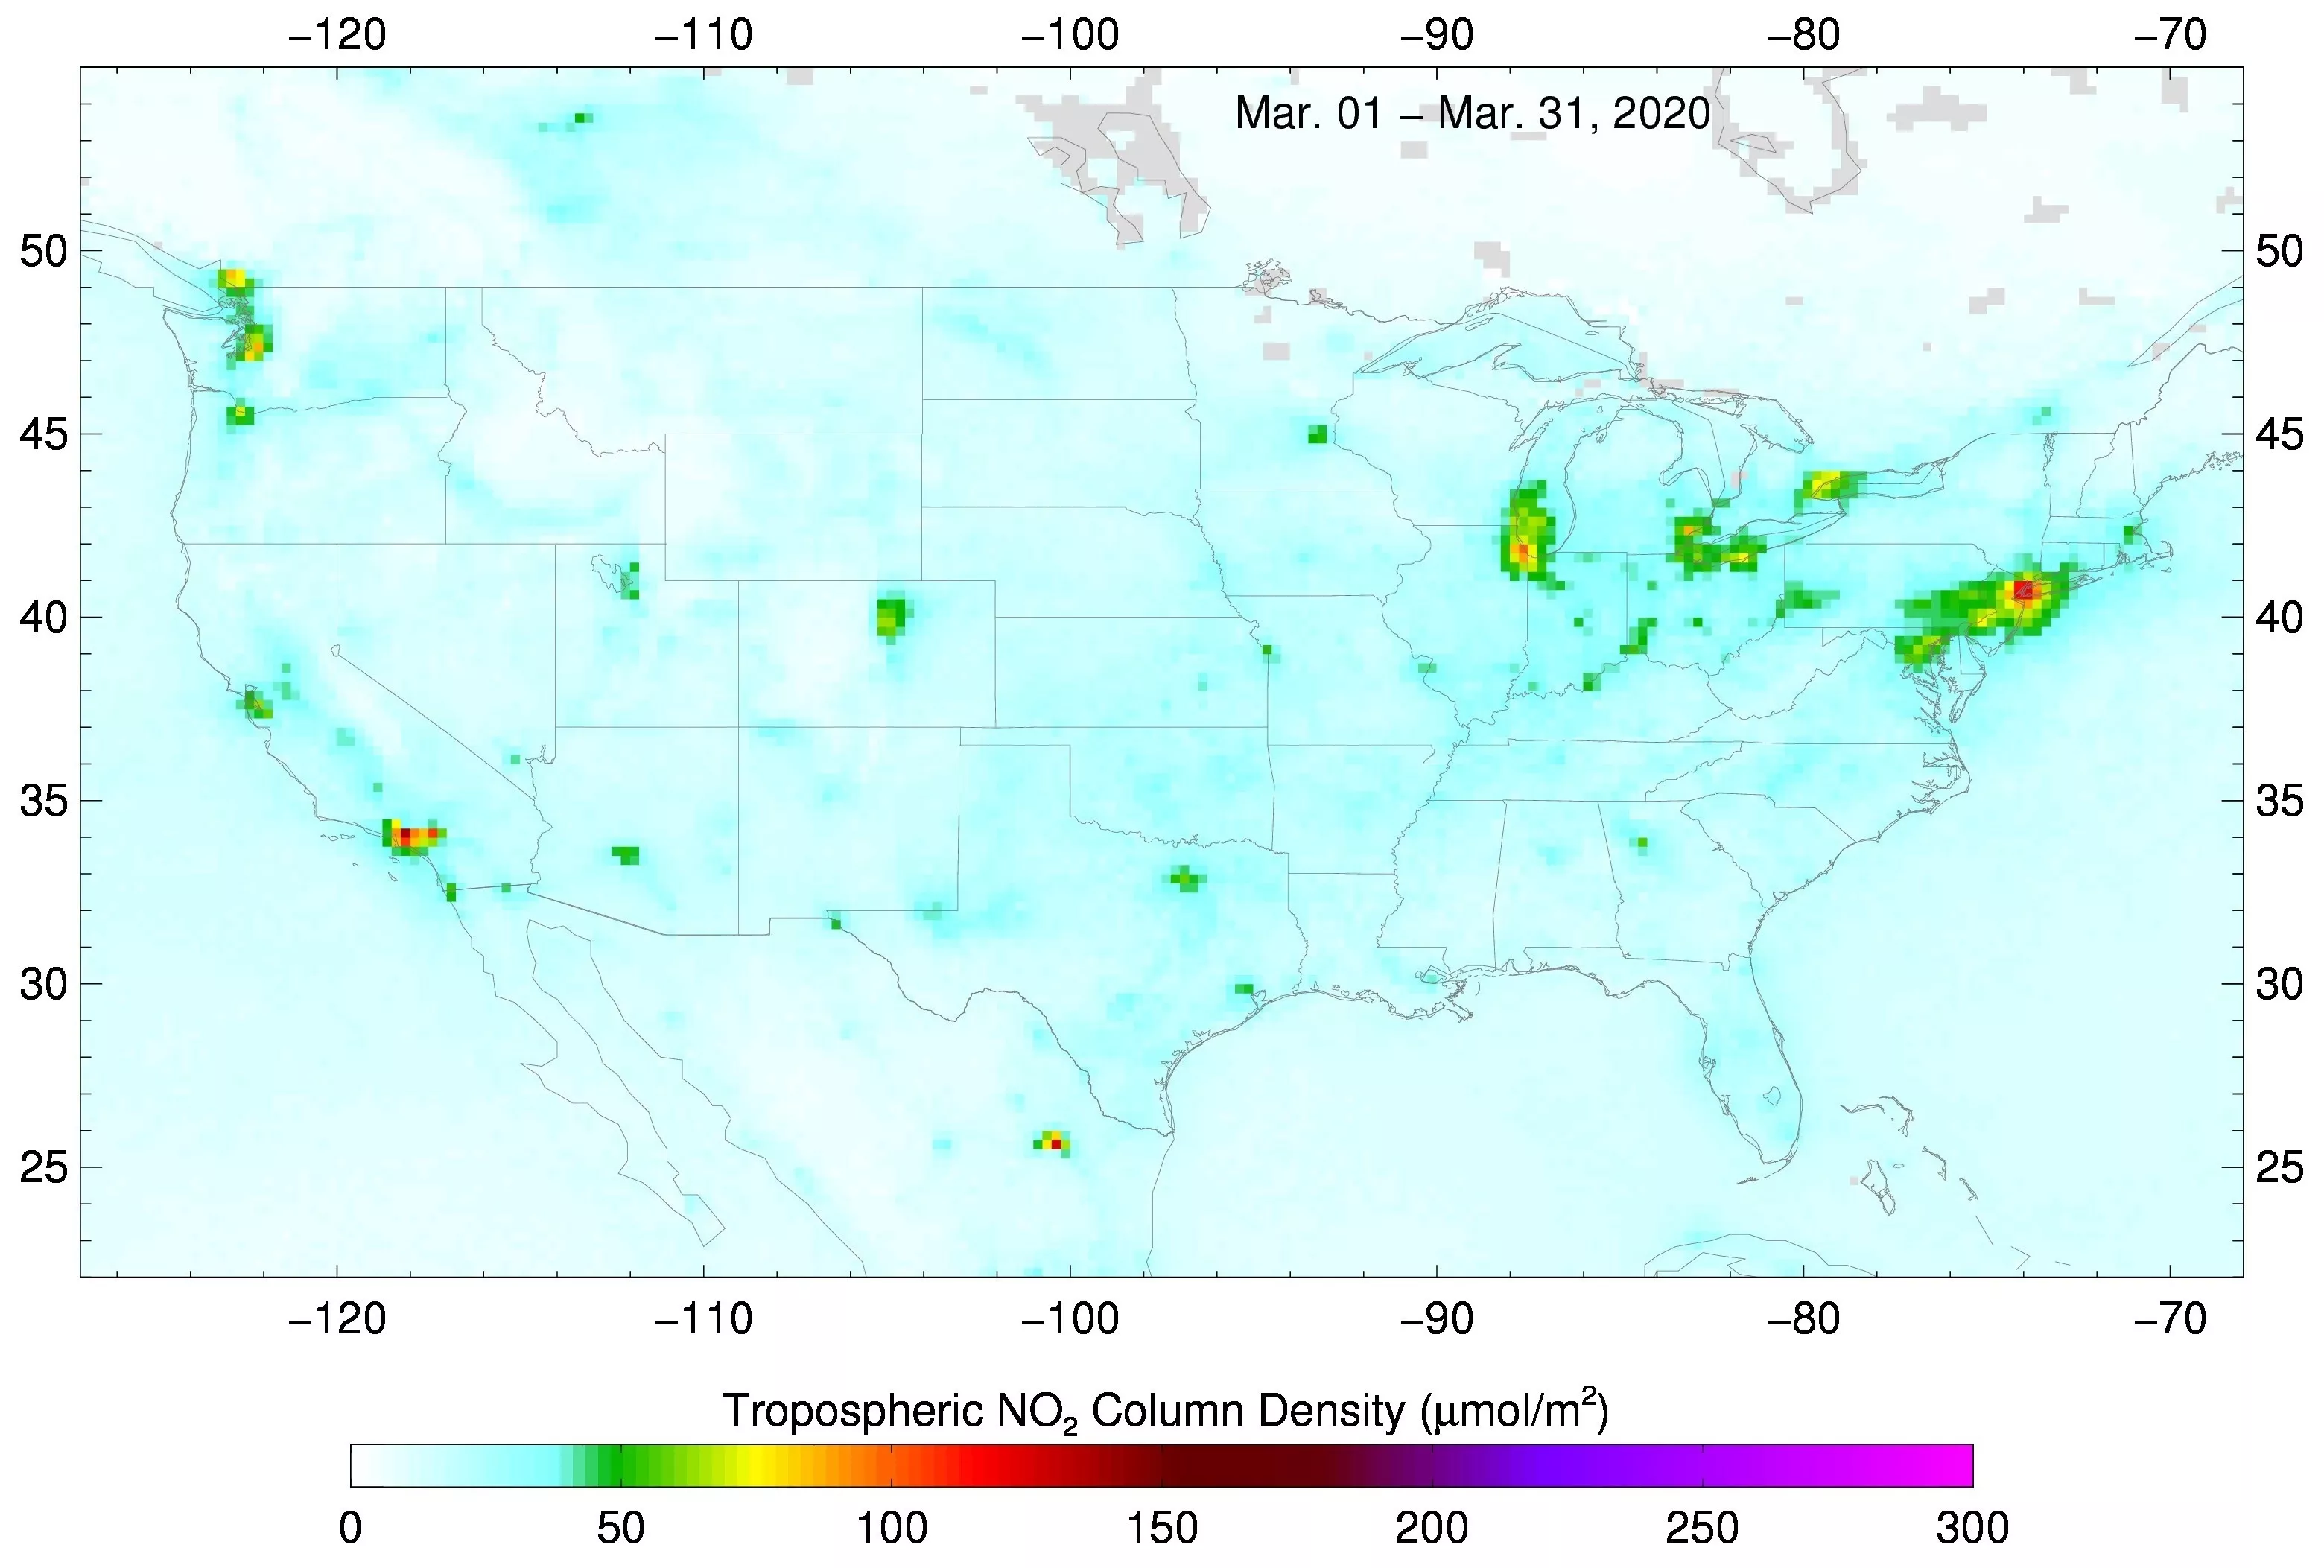
In the images above, using satellite observations from ESA’s Sentinel-5P satellite, regions in the U.S. that typically have high NO2 emissions (Los Angeles, San Francisco, the I-95 corridor in the eastern U.S., Chicago and Ohio River Valley) show higher NO2 pollution in March 2019 compared to March 2020.
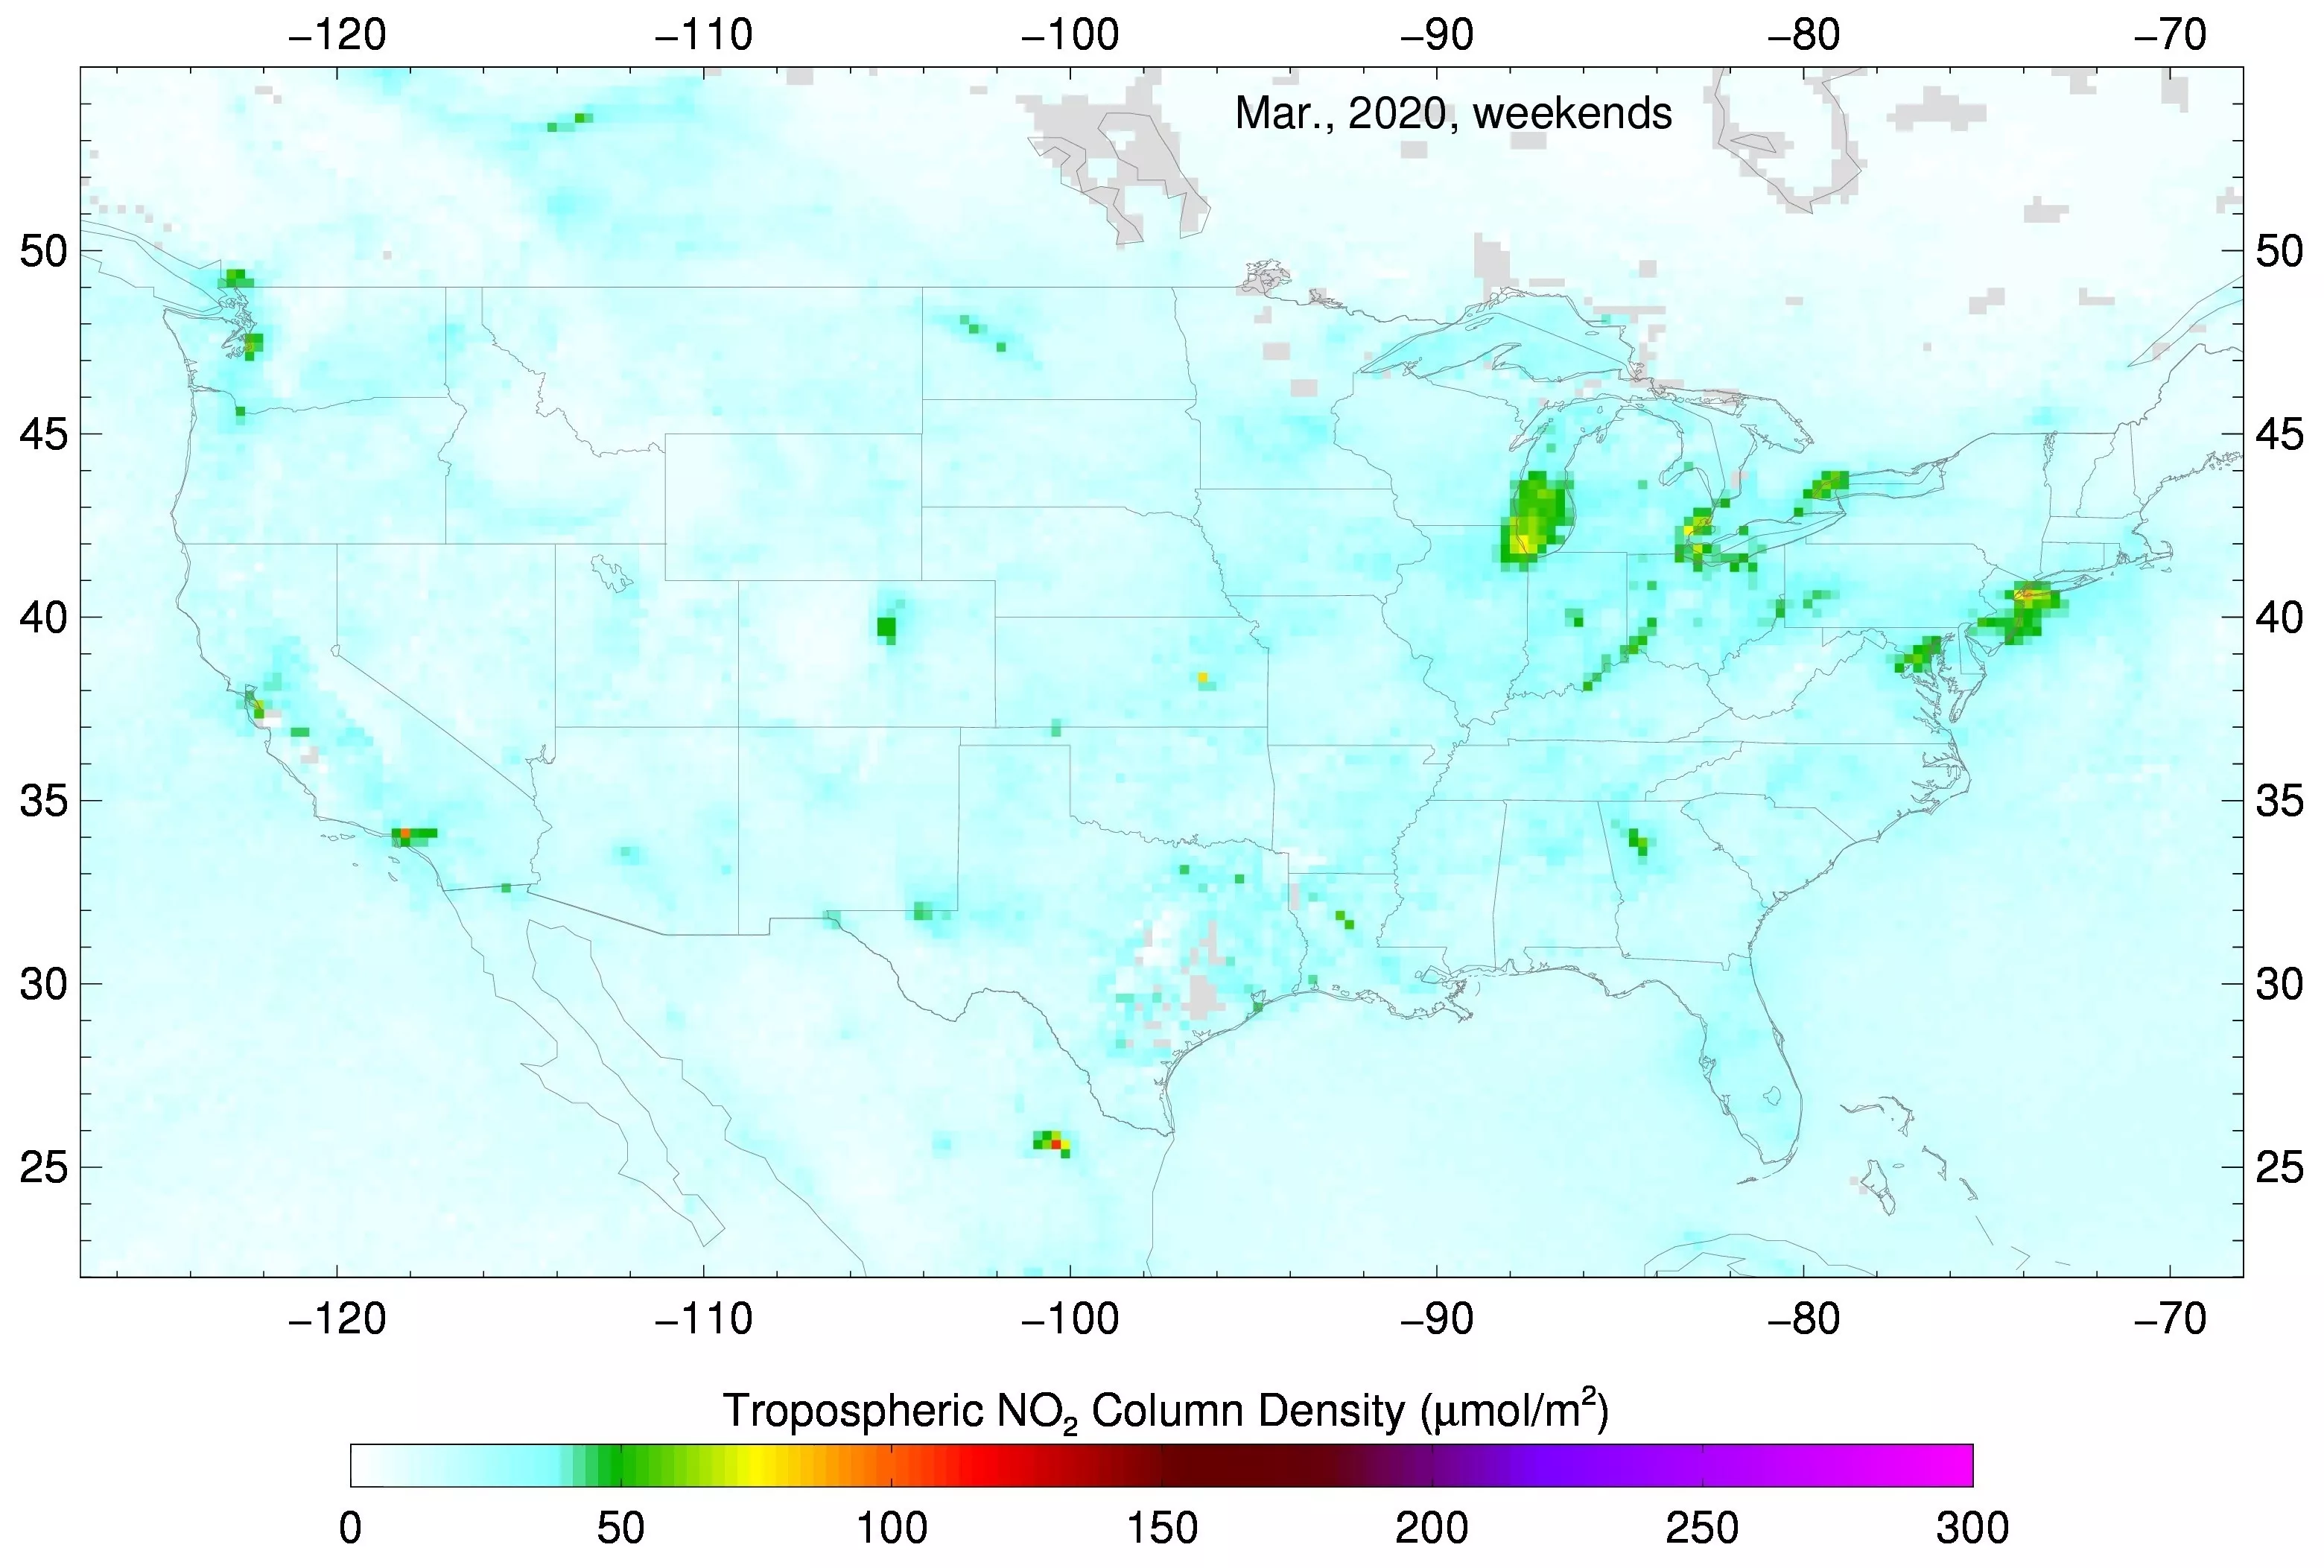
Even more remarkable is the difference in NO2 emissions between weekdays and weekends in March 2020. Despite substantially reduced NO2 pollution in general during March 2020, there are even more discernible reductions on weekends due to reduced traffic.
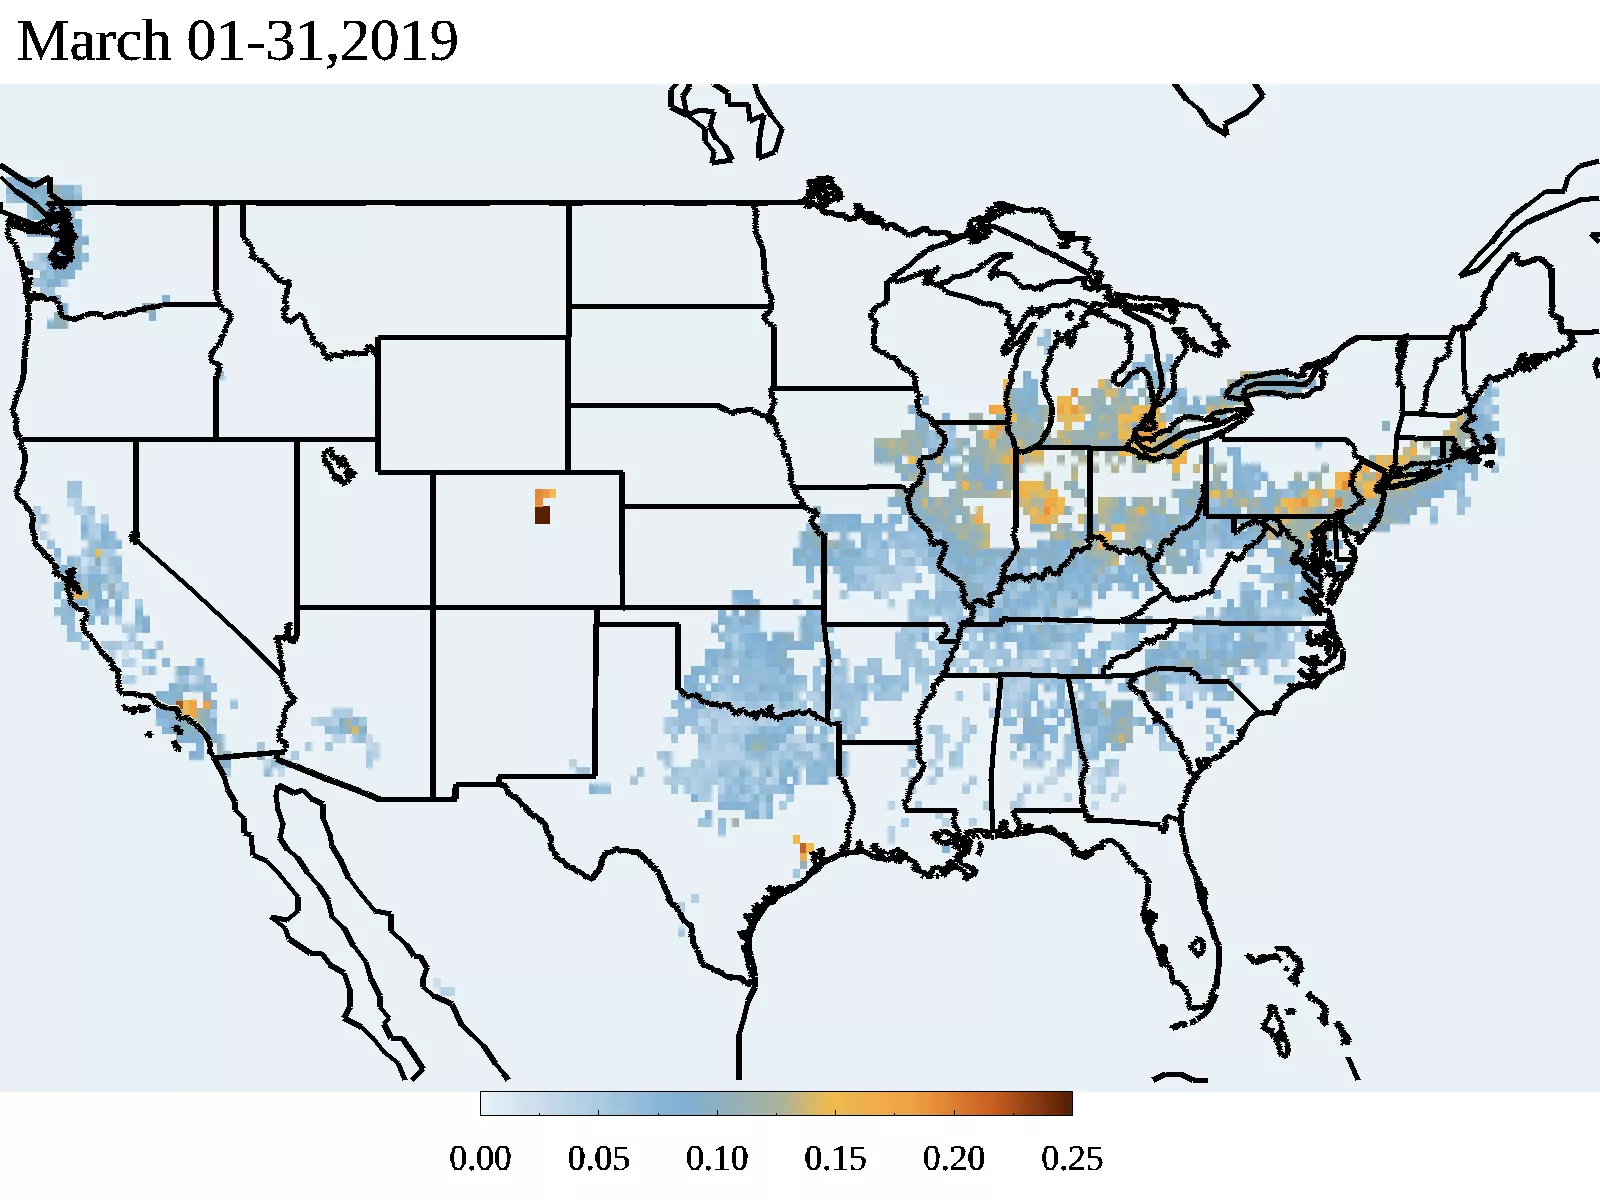
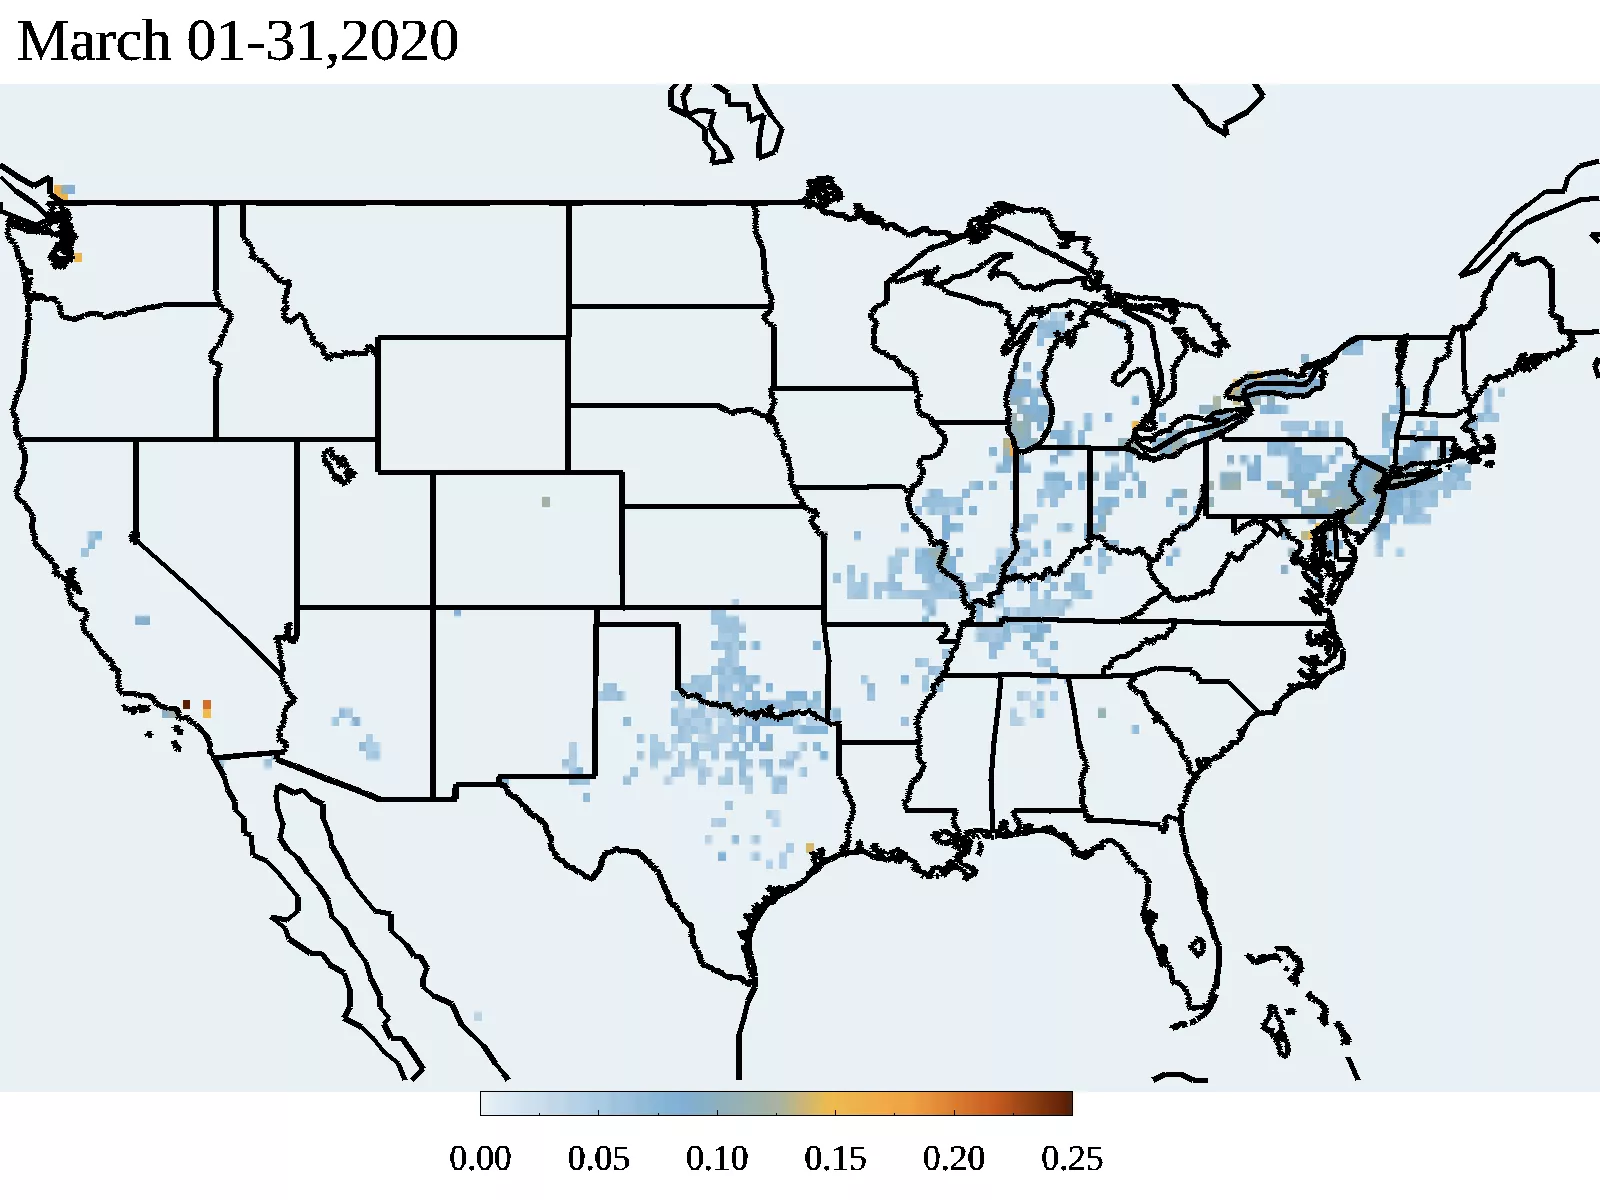
When looking at COVID-19’s impact on airborne particulate pollution (using data from the Suomi-NPP satellite; see images above), NOAA scientists looked at differences between March 2019 and 2020 in the same locations where the ESA Sentinel-5P satellite observed high NO2 pollution. Since vehicular traffic produces NO2 emissions and airborne particles, the scientists were able to assess the related reduction of both NO2 and particulate pollution in 2020.
While there can be year to year changes in NO2 associated with weather patterns, the dramatic NO2 reductions in 2020 were likely caused by a combination of both COVID-19-reduced emissions as well as differences in weather. “Teasing out how much each contributed to the reductions in NO2 and particulate pollution will require additional study by NOAA scientists,” said Shobha Kondragunta, lead scientist for JPSS and GOES-R aerosols and atmospheric composition science team.
With the summer months just around the corner—when U.S. pollution levels generally increase due to warmer weather—NOAA’s scientists and satellites will continue to monitor the environmental impacts across the U.S. from the COVID-19 pandemic.