A new interface using data from NOAA's National Center for Environmental Information is helping the transportation sector better predict when conditions prompting load restrictions will occur and how long they’re likely to last.
When it comes to transporting goods and raw materials around the country, most of us envision an 18-wheeler charging down an interstate highway. However, in many rural areas, “low-volume” roads (i.e., roads with traffic volumes generally less than 400 vehicles per day) make up a significant percentage of the routes such goods and materials travel.
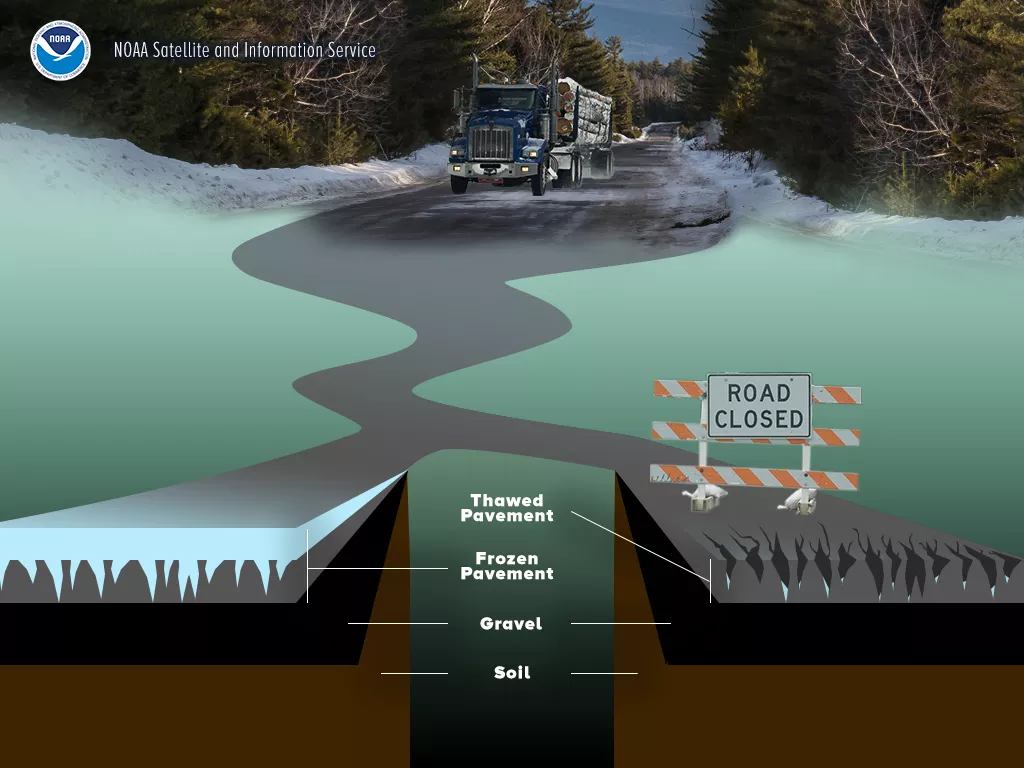
In many northern states, seasonal fluctuations in temperature (known as “freeze-thaw” conditions) can have a significant impact on the surface quality of these roads, so state departments of transportation (DOTs) adjust allowable weight limits up or down depending on how warm or cool it is. In the heart of winter, when the roads are frozen solid, transportation agencies take advantage of roads’ their increased strength and stiffness and apply winter weight premiums—increases in the allowable weight trucks can haul. During the spring, when temperatures rise and the once-frozen roads begin to thaw, the structural integrity of the roads can weaken, making them more susceptible to damage from heavy trucks.
These decreases in allowable weight limits are known as seasonal load restrictions (SLRs), and although they're beneficial for preserving road surface quality, SLRs can cause significant impacts to local industry and economies. Therefore, there is a strong interest among members of the transportation sector to devise ways for predicting when the conditions that prompt load restrictions will occur and how long they’re likely to last.
To help road managers make those predictions, Ellen L. Mecray, Regional Climate Services Director for NOAAs Eastern Region, worked with several members from the Infrastructure & Climate Network (ICNet) to help span the boundary between climate scientists and members of the transportation industry. The ICNet, directed by Jennifer Jacobs at the University of New Hampshire, is a network of engineers and scientists that was formed to help integrate climate science and engineering research for sustainable transportation infrastructure in New England.
Arthur T. DeGaetano, Director of NOAA’s Northeast Regional Climate Center (NRCC) and Professor of Earth and Atmospheric Sciences at Cornell University, and Heather J. Miller, a Professor of Civil and Environmental Engineering at the University of Massachusetts–Dartmouth (UMASS), worked with Jacobs and Mecray to figure out how NCEI’s climate data could be put to use for the benefit of the transportation sector. Collectively, they created a roadway freeze-thaw map interface (patterned after a similar interface developed by the Minnesota Department of Transportation (MN DOT)) that allows road managers in the northeast to better assess when load restrictions should be applied or suspended.
“In the winter, the roads are very stiff and strong because they’re frozen and can take the additional weight. But in spring, when the roads start thawing, you get a thawed layer that’s very saturated and very weak above a still-frozen layer, which causes distress to the roads. When this happens, [road managers] enact load restrictions,” said Miller. “For maximum protection of the roads, managers might tend to put the restrictions on early and keep them on longer, but that would hamper industry quite a bit.”
The decision to enact or remove load restrictions can have environmental implications as well. If a commercial trucking company needs to deliver a lot of freight quickly, for example, it may have its trucks go many miles out of their way to avoid roads with weight restrictions. Alternately, they could travel over the posted roads, but would have to haul with reduced loads, which would increase the number of truckloads required to transport the goods. Obviously, either alternative leads to the use of much more fuel and greater emissions of carbon.
To balance the needs of the industry with conservation of the roads, as well as the environmental impacts associated with increased fuel consumption, state DOTs are looking for scientific approaches to the decision-making process.
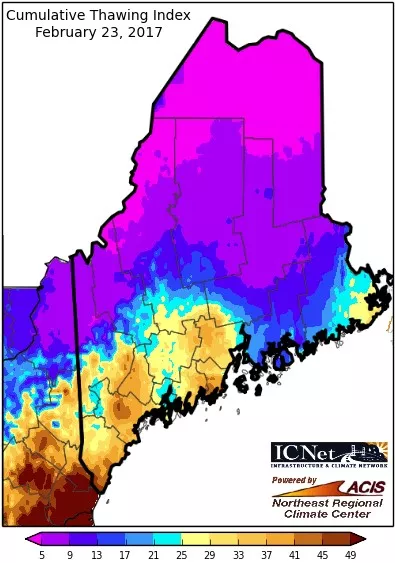
One of those scientific approaches, developed by the MN DOT, uses air-freezing and air-thawing indices. Air-freezing indices are accumulated daily indexes of how many degrees the temperature is below 32 degrees Fahrenheit, the freezing point for water. Air-thawing indices are a little more complicated, as they incorporate accumulated daily indexes of how many degrees the temperature is above 32, as well as several other variables. According to the MN DOT, when the cumulative freezing index (CFI) gets up above 280 degree Fahrenheit days, the roads should be frozen enough to accommodate winter weight premiums. Conversely, the agency recommends that when the cumulative thawing index (CTI) exceeds 25 degree Fahrenheit days, spring load restrictions should go into effect.
The NRCC’s Roadway Freezing-Thawing interface adopts this methodology, and generates real-time color-contour maps – for Maine, New Hampshire, and the Northeast. Infused with the latest temperature data from NOAA’s National Centers of Environmental Information (NCEI), these maps allow regional DOTs to get a sense the freeze-thaw indices in their states, and thus to make decisions on when load restrictions ought to be applied or removed.
Up and running since November 2016, the interface has the potential to help road managers make decisions about enacting or removing load restrictions more objectively.
“One of the potential benefits of the tool is to get around what’s often a more intuitive or experience-based approach to enacting load restrictions,” said DeGaetano. “One of the reasons the application of load restrictions hasn’t been more consistent is that there hasn’t been any concrete guidance to go on. Potentially, once we get the word out about this to more DOTs, we could show road managers that there is a tool they can use to help them make more-informed decisions.”
The NRCC’s efforts to simplify the process of applying winter weight premiums wasn’t the first, said Miller.
“The MN DOT, which has really pioneered a lot of this research and developed cumulative freeze and cumulative thaw index protocols, has a similar-type of interface that shows freezing and thawing contours for its state. We had looked at that when I started doing this work at UMASS, working with the Maine DOT, but we just didn’t have the capability to do something like that. We created a much simpler product, which was helpful, but this [interface] has taken it a step forward.”
So what did DeGaetano and Miller have that prior efforts to establish such web-tools did not? For DeGaetano, it was “access to the right data and the right access to the data.”
“The biggest issue was just having the data at the needed resolution that could be updated in real time,” he said. (Four-kilometer gridded data are used to compute the freezing and thawing indices on a daily basis.) “Road managers need to have something waiting for them today when they need to make a decision. That is exactly what our data information system is designed to provide—the direct communication of information from the database, through the interface, to the user.”
DeGaetano added that, creating interfaces like this is precisely the kind of work that NCEI’s Regional Climate Centers were created to do: get climate and environmental data to users through efficient, easy-to-use applications.
“When this [request] came around, we evaluated it and said, ‘Boy, we’re really set up to do this. It isn’t a big ask and there’s a lot of potential value.’ This is supposed to be what we’re doing for NOAA, and the infrastructure we’ve developed made this an efficient [project] to move forward.”
Another benefit of the NRCC interface is that it not only informs road managers of the freeze-thaw conditions on a particular day, but also incorporates weather forecasts for up to 6 days in advance, thereby allowing them to make decisions more strategically. “If I’m a road manager at a state DOT, it’s nice to know what today’s conditions are,” DeGaetano said. “But if I have to make a decision, it’s nice to have that lead time as I might have to start doing something if it’s expected to get warmer or colder.” Miller agreed.
“Most states require three to five days advanced notice to enact weight restrictions. So, to be able to see conditions in advance—to know that, although it’s been warm for a couple days, it’s going get colder, or vice versa,—will help DOTs operate more efficiently.” And what do the DOTs in the Northeast think about it?
“We’ve gotten some good feedback from Maine DOT, which looked at it this winter. They were very happy to see that when the CTI was telling them to apply weight restrictions, measured subsurface temperature data at roadway test sites showed that the roads were, in fact, thawing,” Miller said. “I think we’ve got a really good tool now and I think if some modest funding is available in the future, there could be some tweaking done to make it even a little more usable.”